Stations
Go directly to a station using the buttons below, or use the menu or buttons at the top of the screen to move through the stations in order.
= Page includes questions or opportunities for comment.
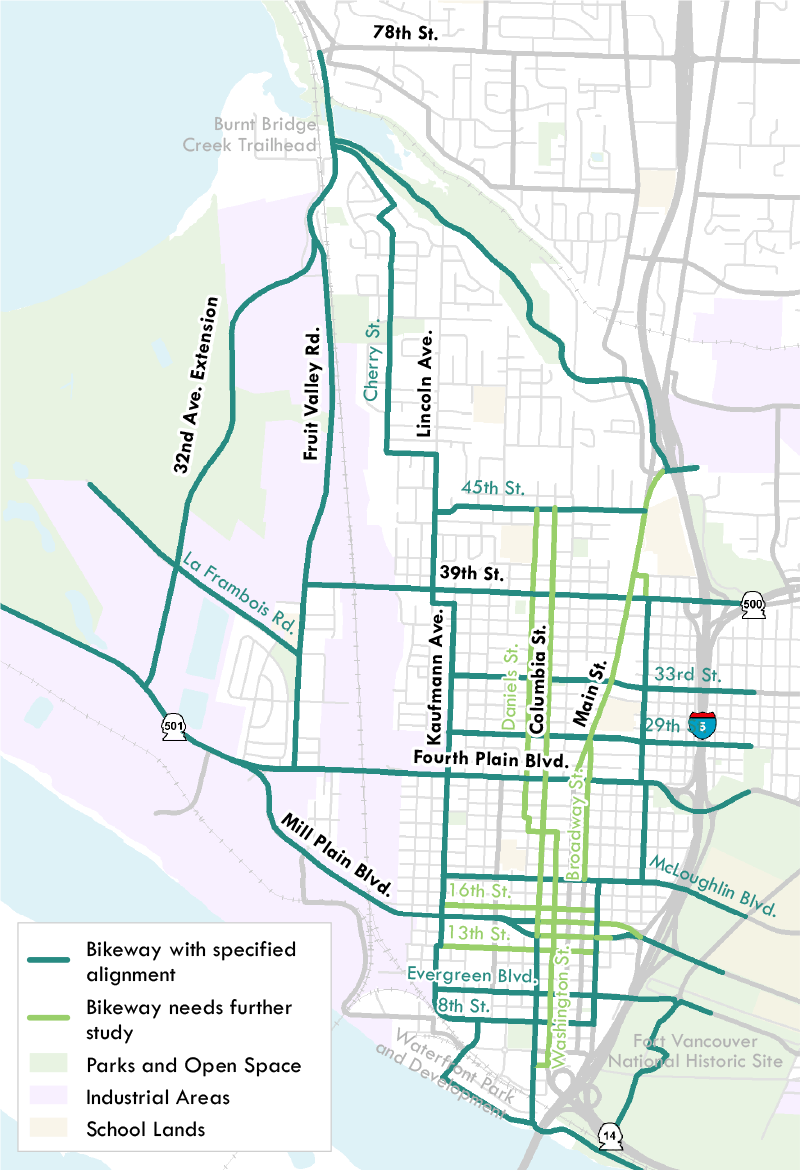
Bikeways Map


Why are we doing this?
The Westside Bike Mobility Project will help implement the Westside Mobility Strategy by identifying and developing design concepts for two new north-south bike routes that will better connect the Fruit Valley, Northwest, Lincoln, Shumway, Carter Park, Hough, Arnada, and Esther Short neighborhoods to downtown Vancouver (from the Burnt Bridge Creek Trail to the north to the Columbia River Renaissance Trail to the south).
Bike routes will not be constructed with the project, but the concepts developed in this project could guide changes to roads during upcoming repaving projects in 2019 and beyond.
Possible routes will:
- Be located east of Fruit Valley Road and west of Main Street
- Likely include Daniels Street, Columbia Street, Lincoln Avenue, Kauffman Avenue, Franklin Street and/or Washington Street
- Connect the Burnt Bridge Creek Trailhead at NW Lakeshore Avenue to the Columbia River Renaissance Trail at the south end of Columbia Street
Scroll down for questions you can answer.

Recommended bikeways concept from Westside Mobility Strategy (Click to enlarge.)
Questions
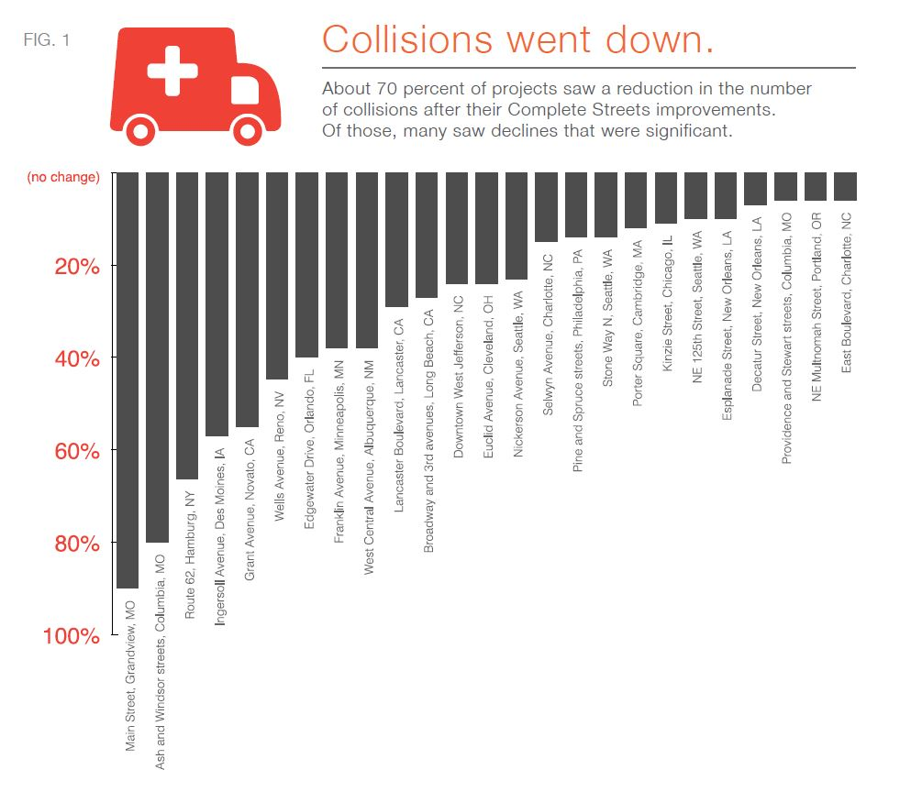
Fewer collisions on Complete Streets

Washington’s Complete Streets bill became law in 2017. It defines Complete Streets this way:
“Safe access to all users, including bicyclists, pedestrians, motorists, and public transportation users….”
Building on that, the City of Vancouver’s 2016-2021 Strategic Plan includes developing and maintaining a safe, balanced and innovative transportation system that will meet the needs of future generations. Such a system:
- Is safe and accessible
- Benefits all users—regardless of how they travel
- Is convenient and interconnected
What are the benefits of Complete Streets?
Complete Streets reduce the level of traffic stress, or LTS. LTS is a measure of how comfortable a street might feel for biking. Reduced LTS can take surprising forms. For example, these places that attract more people to walk and ride bikes have fewer collisions. (See the graph on this page, showing Complete Streets project outcomes from across the country. [From Smart Growth America: Safer Streets, Stronger Economies ])
What’s more: In New York City, streets with protected bike lanes — that is, with lower LTS — had 40% fewer injury crashes for all road users over four years from 2006 to 2010. Complete Streets can bring benefits to everyone, including those who don’t ride.
To encourage more people to ride and walk, planners and engineers test and update roadways for LTS. Tests are scored on a scale of 1 to 4, on factors including the posted speed limit, number of lanes, and the type of existing bike lanes.

Fewer collisions on Complete Streets (click to enlarge).
Comment Wall: What would help you ride a bike more often?
characters remaining.
Read other comments...


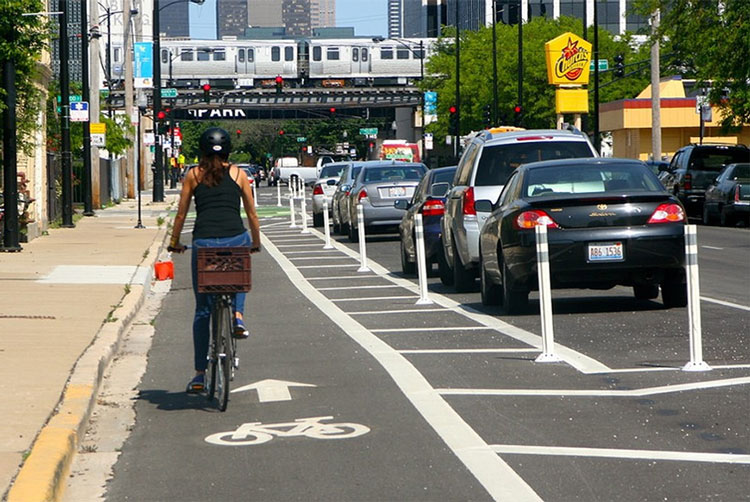


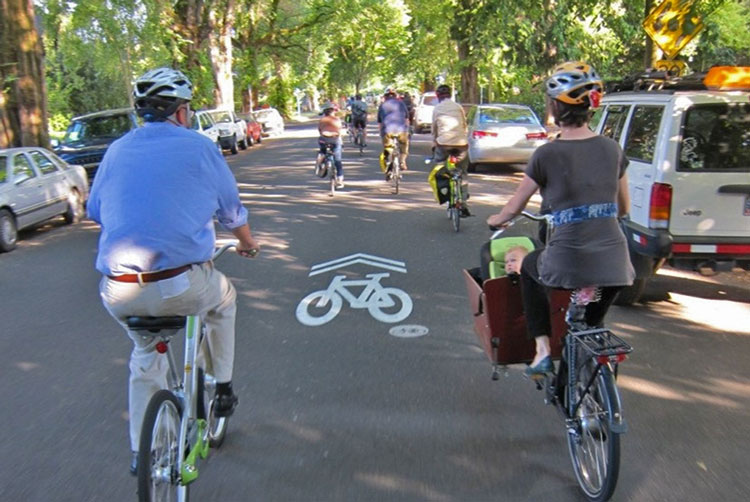
Look at the photos in the gallery on this page. They start with something familiar: a street with standard bike lanes.
Think about how you would rate each one for your own LTS (level of traffic stress).
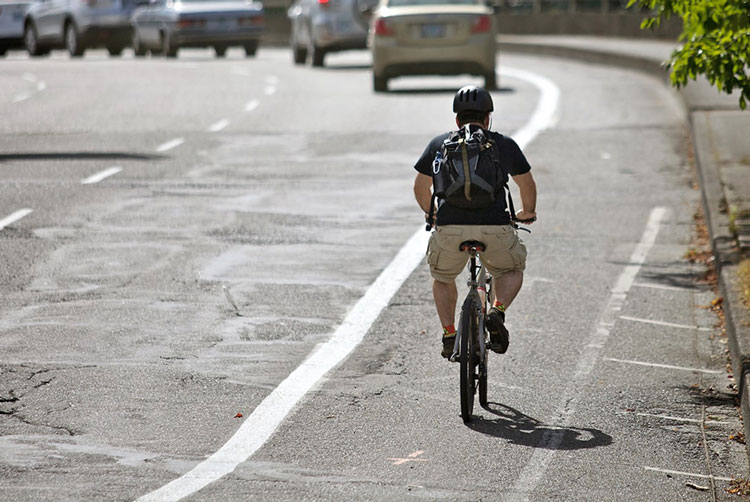
Street with standard bike lanes
Bike lanes are designated with paint and signs only.
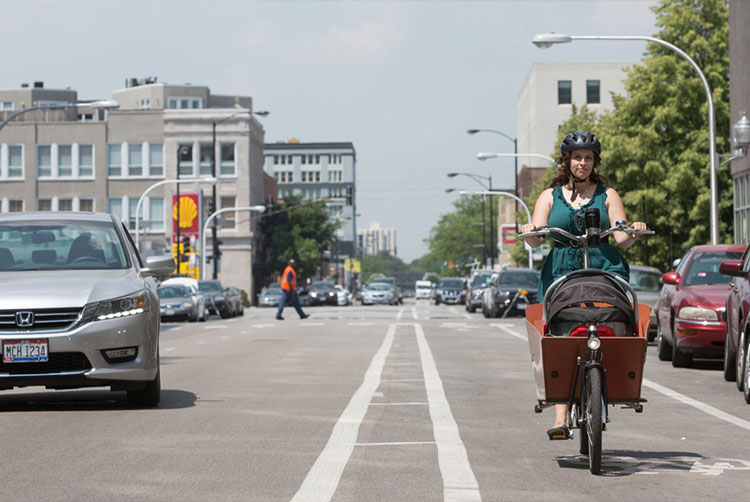
Street with buffered bike lanes
Along with bike lanes themselves, buffer zones are also designated with paint.

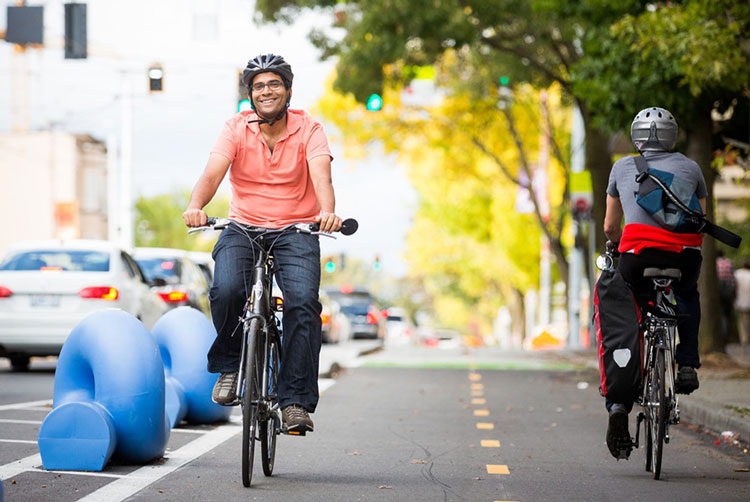
Street with protected bike lanes
Physical objects such as wands or even parked cars occupy space between the bike lanes and other lanes.
Street with two-way protected bike lanes
Bringing both directions of travel together in one protected area is sometimes better.
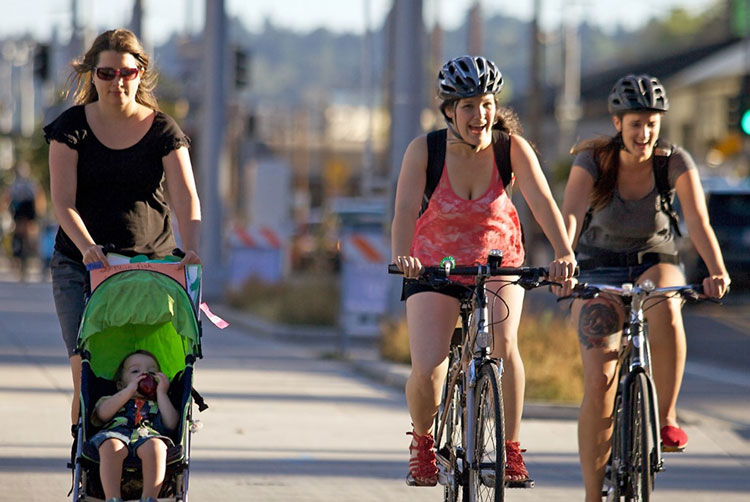
Shared-use path
This type is completely separated from the roadway used by cars, but shared with others such as walkers and joggers.
Neighborhood greenway
Riders share the same space with cars on designated low-speed, low-volume streets.
Questions
How important are the following evaluation criteria to you?
Total Spent: 0/28
Use the sliders to divide points between the criteria below. You can assign up to 7 points to each. If you run out, you can shift points between categories until you are satisfied with the balance you achieve.
Access and ConnectivityAccess and connections to popular and useful destinations such as schools, parks, shopping and transit stops — not only those in downtown, but on the way. |
0 |
EquitabilityEquitable access that significantly includes communities of concern, including users who identify as low-income or minority. |
0 |
SafetyImproving safety for all, including those traveling by foot, bike and car. |
0 |
CapacityIncreasing the number of people (not the devices they ride or drive) that streets can safely, comfortably transport. |
0 |
CommunitySupporting community goals and existing plans. |
0 |
ImpactsLimiting impacts to property values, rents and parking capacity. |
0 |
EconomyEnsuring our streets promote business by moving customers — as well as goods and services — between destinations. |
0 |
Total Spent: 0/28
Comment Map Instructions
- Click Map Options to see the following options at smaller screen sizes.
- Use Find a Place to search the map for streets or destinations.
- Click Add Comment to add your own icons and comments to the map. Click on other icons to read what others have said and leave feedback.
- Use the map controls to zoom in and out and change the map type between roadway and satellite.
- Click Reset to restore the map view.
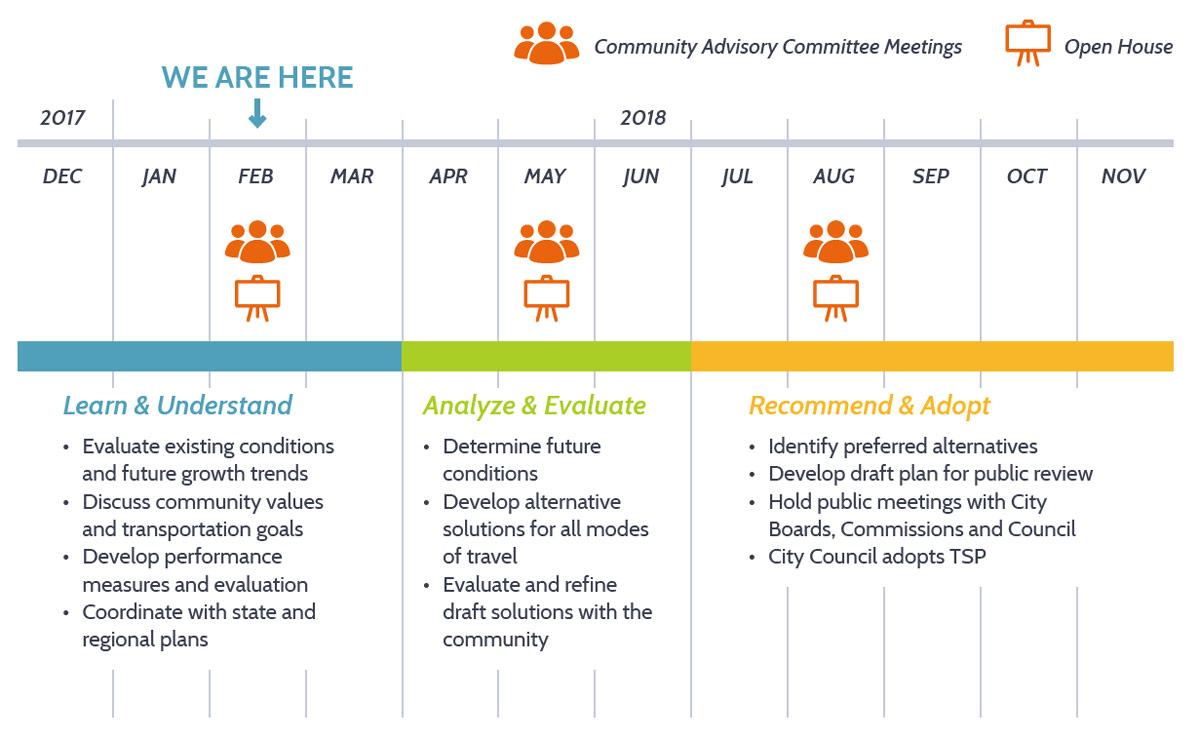
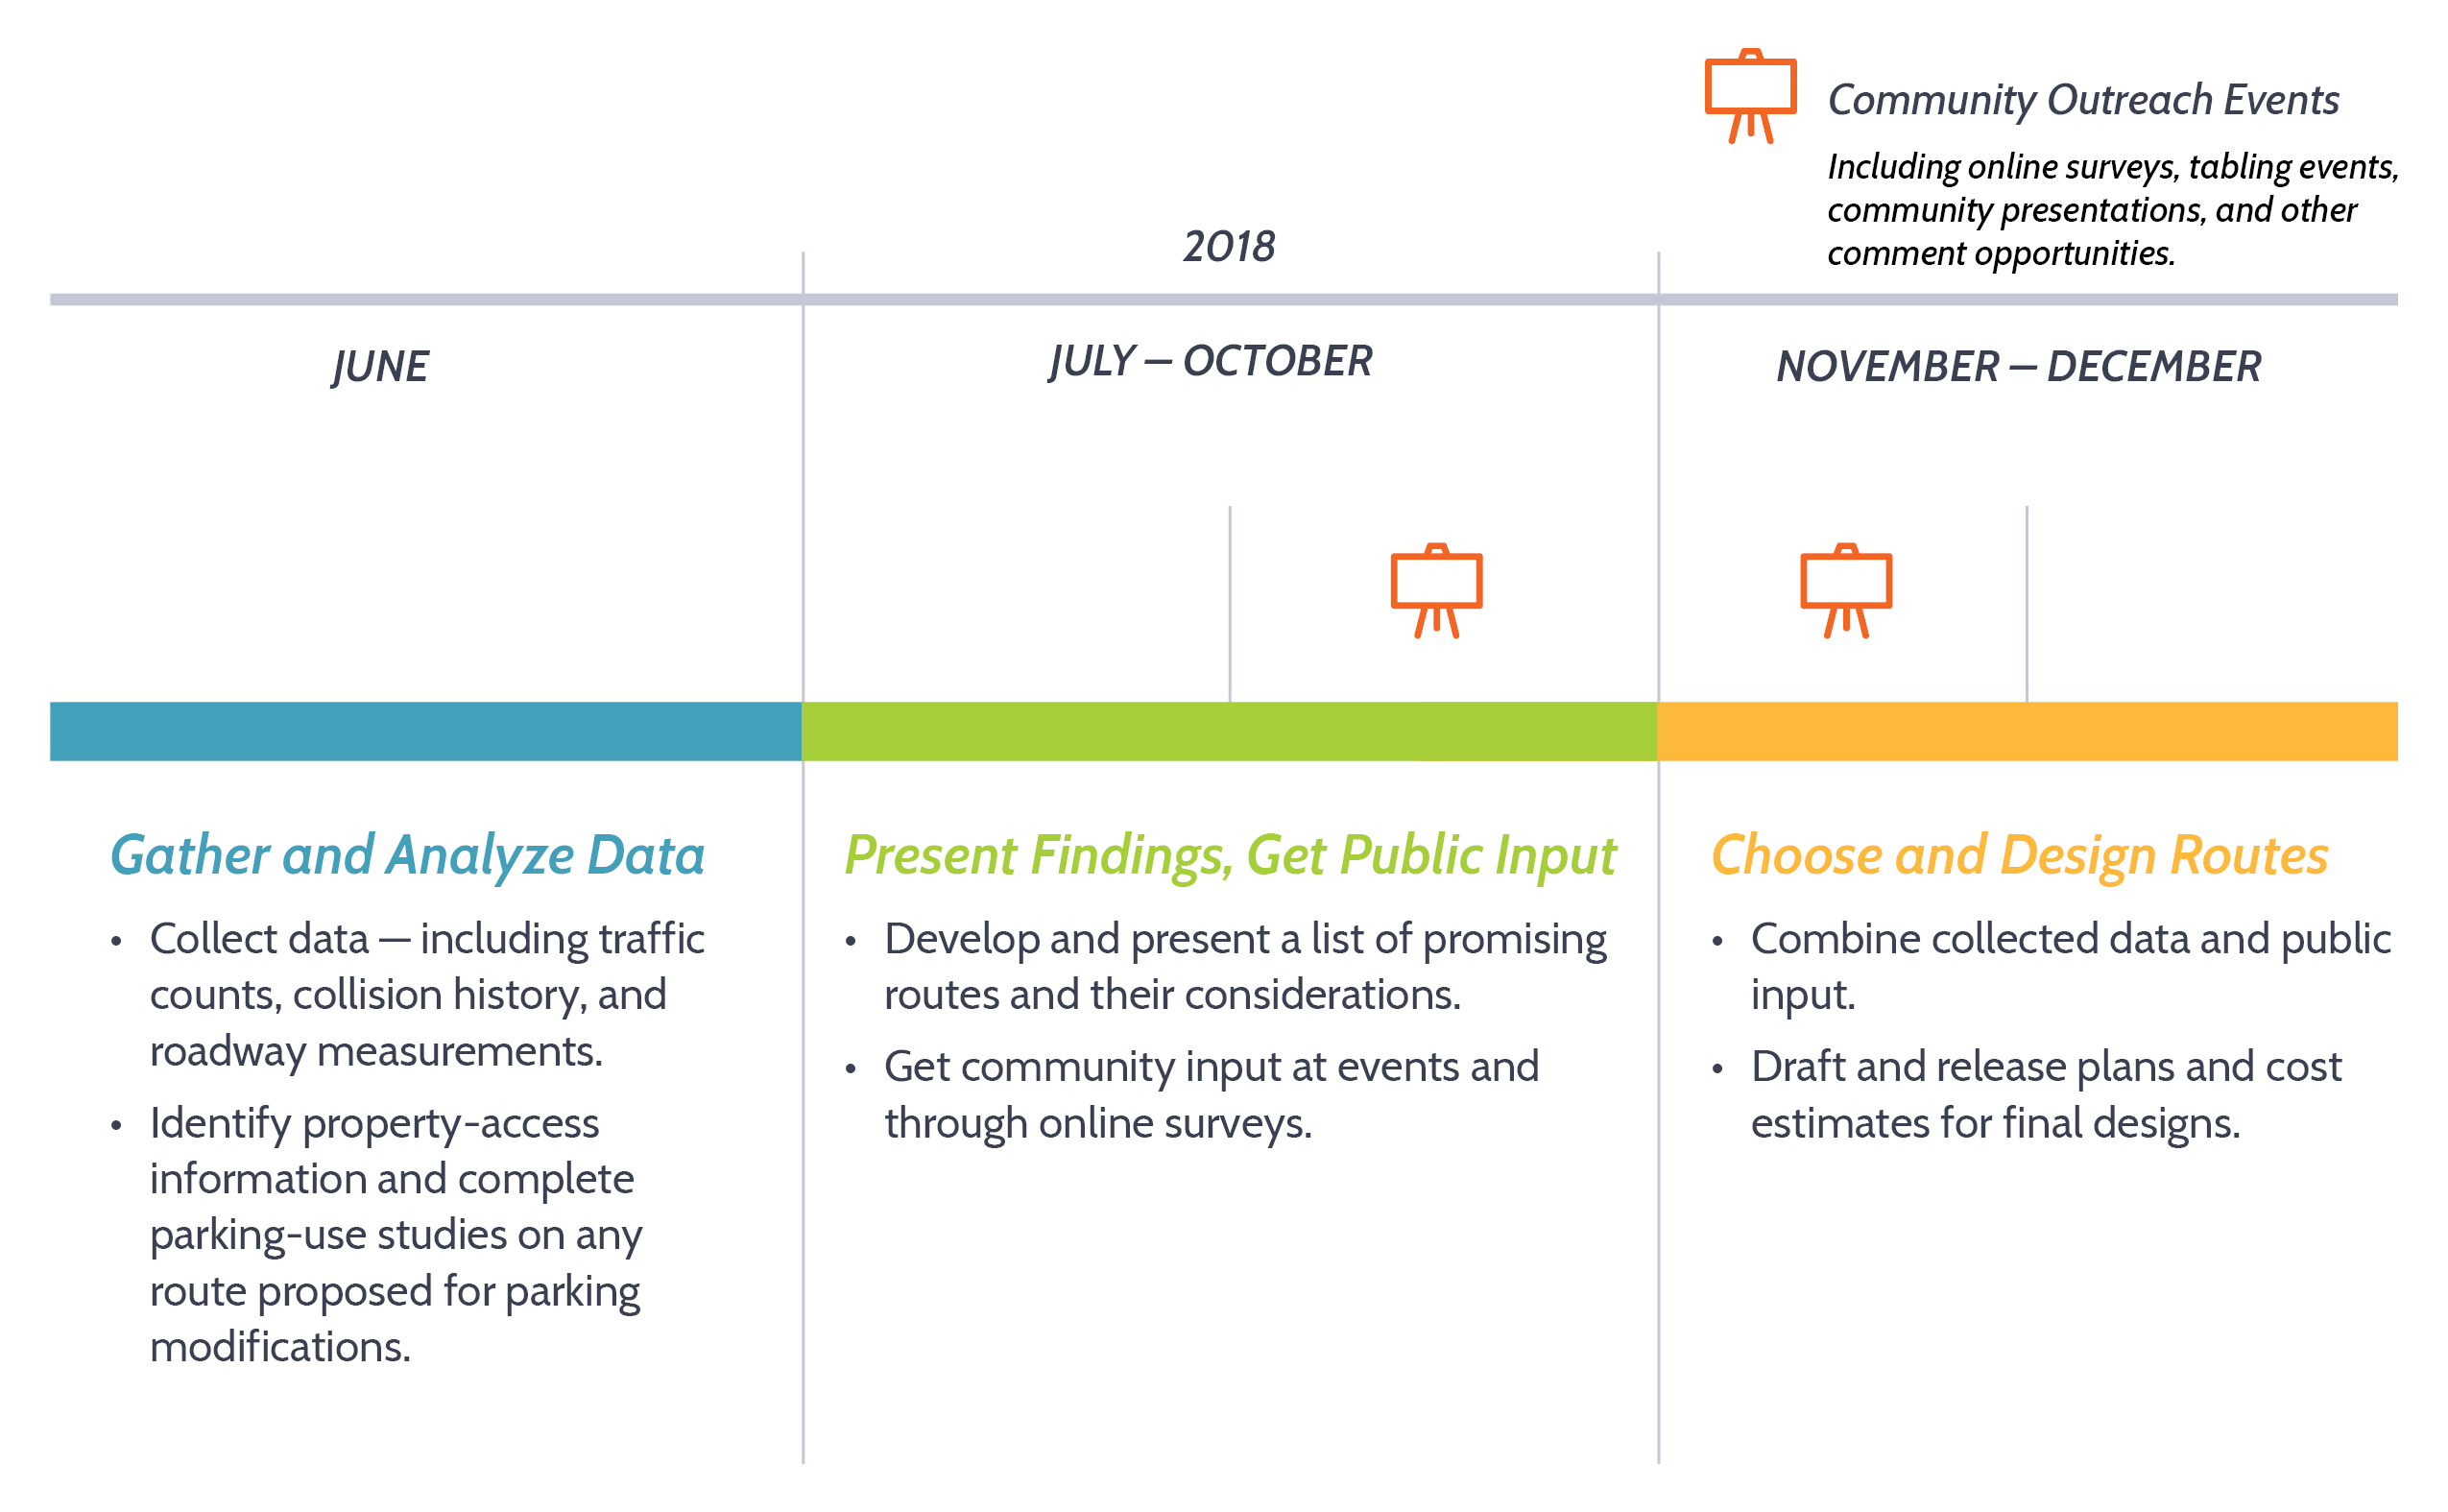
Project Schedule

Stay involved
Your input will help guide our design work. We’ll share draft plans in the next few months for your feedback.
- Learn more on the project website: bit.ly/westsidebike
- Sign up for email updates below.
Timeline
Final questions
Before you leave, be sure to submit any comments you've provided.
