This site may be easier to use if you rotate your device into the "landscape" orientation.
 

Help shape Washington County's transportation future

Washington County is evaluating long-term transportation strategies and investments needed to sustain the County’s economic health and quality of life in the coming decades. Learn about the Study, and provide your input in this interactive online open house.

Although new comments are no longer being collected through this online open house, you are welcome to submit feedback using the project website.

Where do you want to go?

1
Learn about the purpose of the Study and where we are in the process. 
2
Learn what our future might look like in the next 40 to 50 years and how the way we travel might change. 
3
Help the study team prioritize funding and investment areas. (SURVEY PAGE 1/3) 
4
These topic specific questions will help the County set future transportation priorities. (SURVEY PAGE 2/3) 
5
Give us feedback, sign up for the project mailing list and enter to win a TriMet transit pass. (SURVEY PAGE 3/3) 

= Page includes questions or opportunities for comment.

Study Overview

The County is growing, and travel needs are changing. The Washington County Transportation Futures Study is a chance to think big, be proactive and consider how the transportation investments we make will shape the County’s economic health and quality of life for years to come.

Video: 2 min 45 sec

The study reviewed past growth trends and developed future growth scenarios for a 40-50 year timeframe that reflects the development of adopted land use plans and areas designated for future urban development. The study collected values that were important to the community for use in considering tradeoffs between transportation investments.

Earlier in 2016, we asked the public to help identify potential transportation investments and ideas to study. We have completed an evaluation of these ideas and investments to see how well they meet anticipated future transportation needs and support community values.

Now, we are ready to share the results with you and hear your input about what we should study further.

Study Schedule
Click to Enlarge (png, 33kb)

The Challenges We'll Face

The County has experienced rapid growth over the last 40 years. Here’s how the County could change in the next 40-50 years...

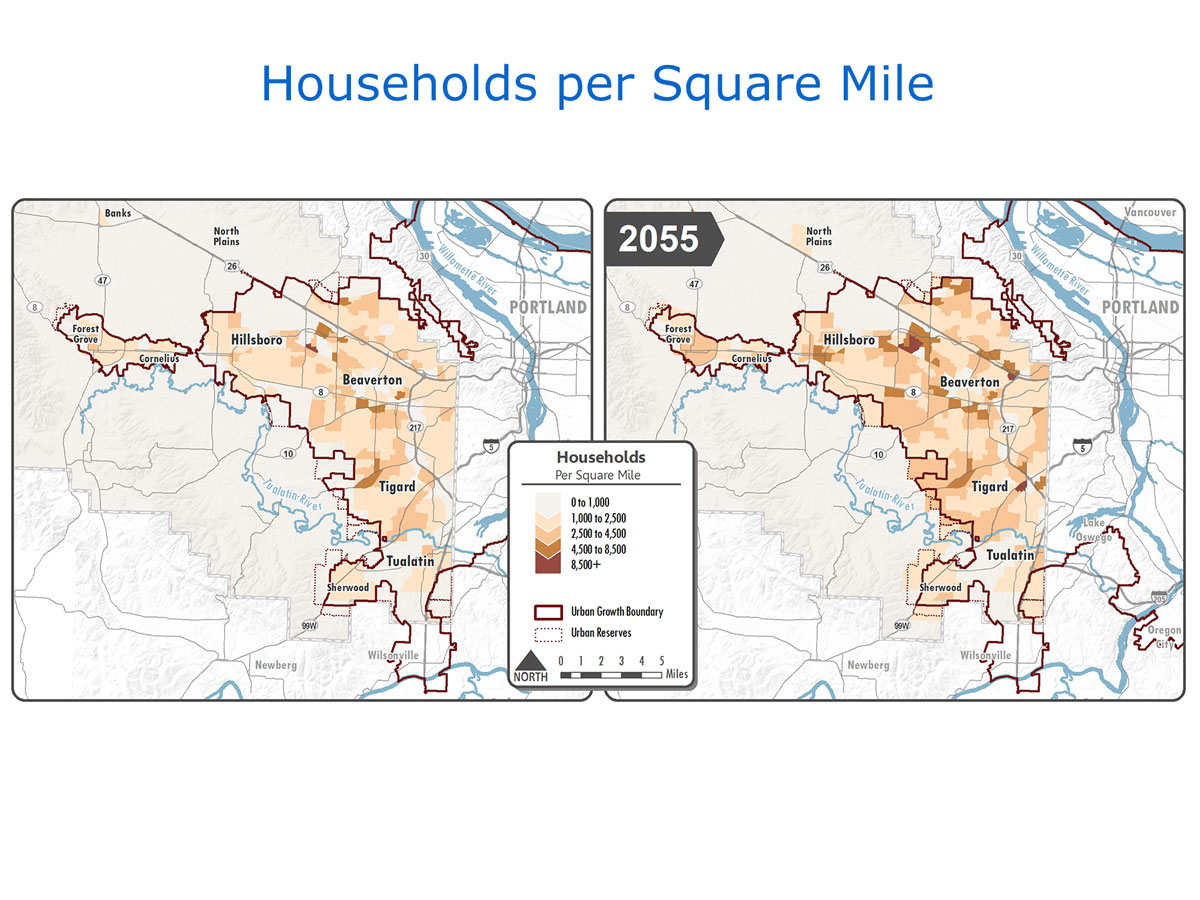
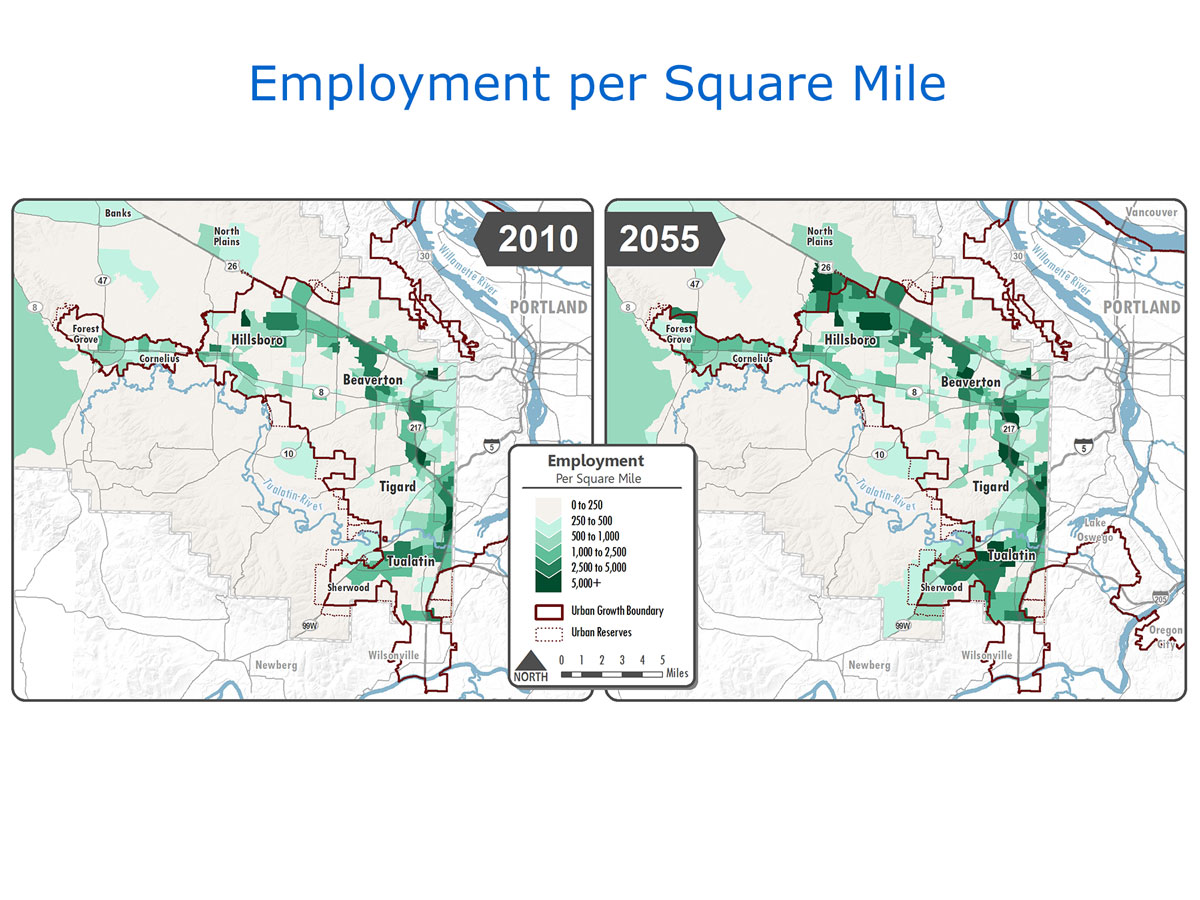
We expect population and employment to grow.

We expect a 41-55% increase in population and a 100-150% increase in employment, depending on growth scenario assumptions. This is like adding at least the population of another Hillsboro, Beaverton and Tigard.

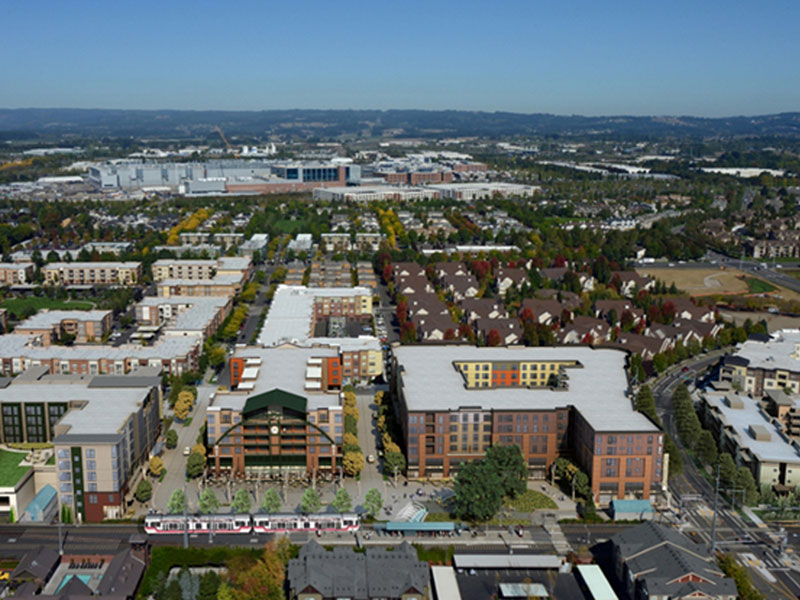
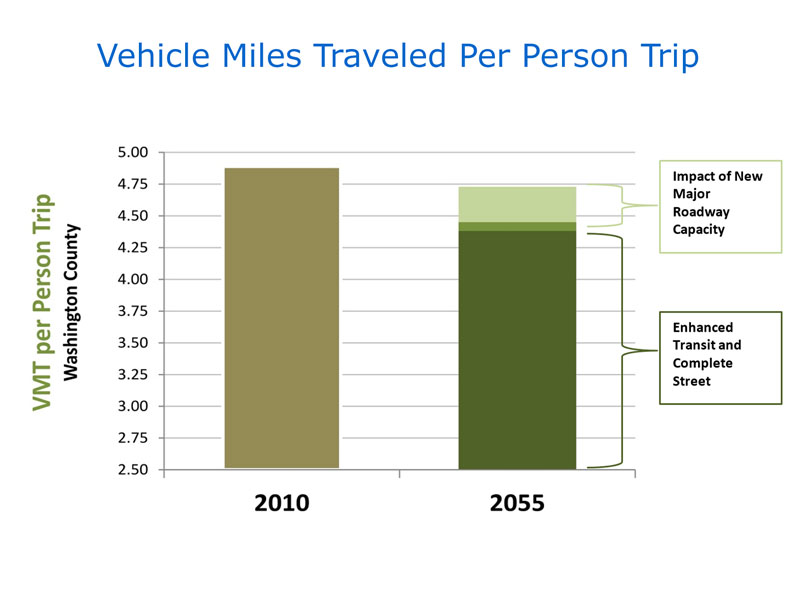
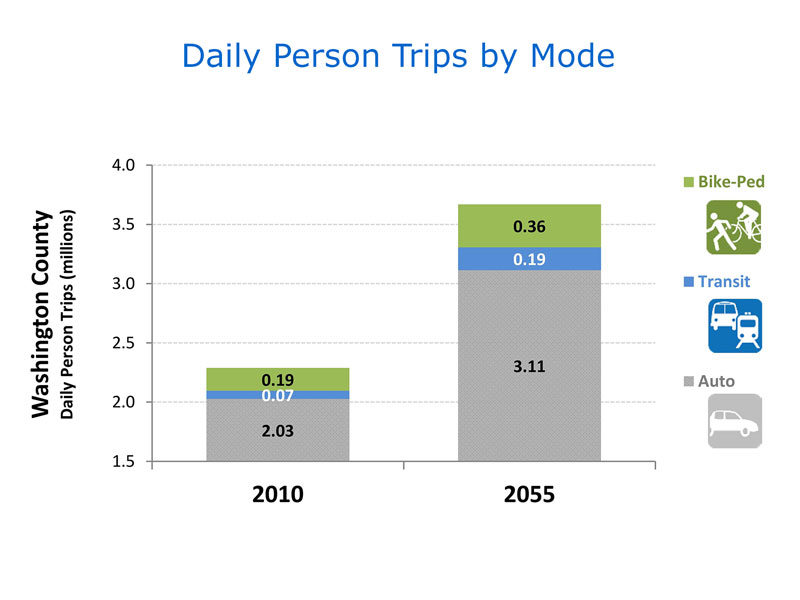
Areas such as downtown Beaverton, Tanasbourne, Tigard Triangle, and other centers are anticipated to continue to redevelop and become more urban. These places are expected to have a mix of residential, employment and commercial uses (similar to the Beaverton Round or Orenco Station), and will require people to drive less. The study found that with increased urbanization and trends in travel behavior, the number of vehicle miles traveled per person trip will continue to decline over time and will be less than in 2010. Transit, biking and walking trips are expected to more than double.

Traffic in 2055 will be much worse without major changes in how we live and travel, as well as major transportation investments.

  • Today there are roughly 2 million trips per day made by car; we expect that to grow more than 50% by 2055.
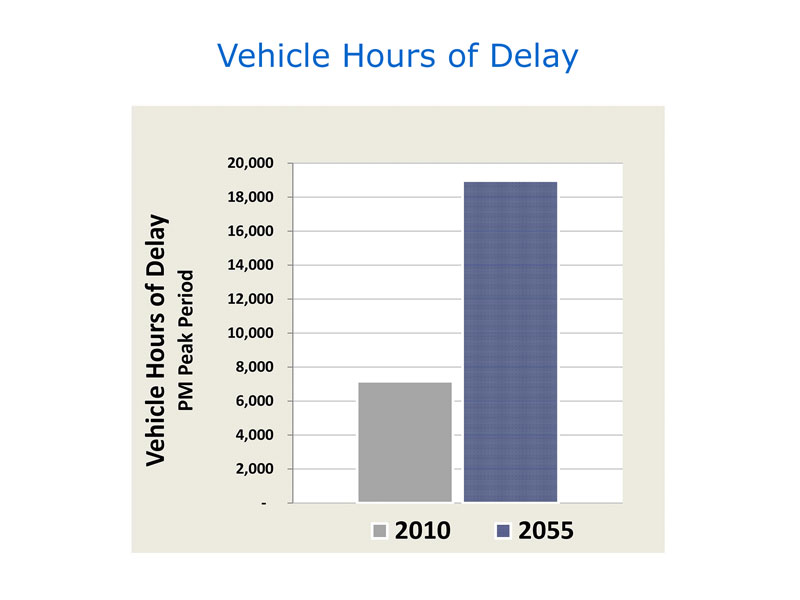
  • Drivers will experience severe congestion most of the day. This congestion will overflow onto major roads, and we’ll see more cut-through traffic on local roads.
  • Traffic delay is expected to double and the number of lane miles exceeding capacity will increase seven-fold. This will negatively impact travel time and reliability and the ability to get freight trucks and commuters in and out of the County.

Provide Input on Options to Improve Our Transportation System

The study found that the priorities we choose today reflect a vision for the transportation needs of future generations. We’d like to know your thoughts on priorities, funding, and objectives.

Video: 9 min 10 sec

As millennials age and new generations emerge, things will be different. With help from the public, the Study Advisory Committee and local and regional agency partners, this study looked at hundreds of conceptual transportation strategies to support the County’s quality of life and economic health in the future. This was an opportunity to explore aspirational ideas and think outside the box. The study considered investing in all modes of travel—driving, biking, walking and transit— because there is no one, single solution to meet future travel demand.

Following are questions on some of the study’s key findings. You can find out more and offer additional input on specifics within each category by selecting the tabs on the following page.


Investment Priorities

Considering the trade-offs, how would you prioritize these transportation options to best meet the County’s quality of life and economic health in the long term? You have 28 points to assign.

Use the sliders to assign points to each transportation option area.

Programs to reduce vehicle trips

More info...
0

Smart Technology

More info...
0

Enhanced Bicycle and Walking Infrastructure

More info...
0

Enhanced Transit

More info...
0

Enhanced Arterial Network

More info...
0

New Roadways

More info...
0

New Freeway Lanes

More info...
0

Total Spent: 0/28

Funding

The study found that the cost of the investments could range from $10 billion (to build out the major urban streets with bike lanes and sidewalks on both sides of the street and implement enhanced transit services) to $12 billion for enhancing our existing roads, to $24 billion to build new roadways, added freeway lands and transit in exclusive right-of-way. These investments would cost more than planned resources could fund.

To fund the priorities you listed on the previous tab, which of the following revenue sources would you support?
Gas tax increase. (Check one.)
Tolling new roads to fund road construction. (Check one.)
Road-user charges based on the number of miles driven. (Check one.)
More paid on and off-street parking areas. (Check one.)

Transportation Objectives

Which of these objectives did you consider in selecting your investment priorities on the previous tab?
Click and drag the options listed below into this box, then arrange by priority.
  • Improving access to essential destinations, such as work and school Not ranked.
  • Improving traffic flow Not ranked.
  • Providing alternatives to driving (such as transit, sidewalks and bikeways) Not ranked.
  • Improving neighborhood livability Not ranked.
  • Improving accessibility for low income households Not ranked.
  • Protecting and enhancing the environment Not ranked.
  • Improving reliability for freight and goods movement Not ranked.
  • Improving safety for vehicles, pedestrians and bicyclists Not ranked.
  • Improving public health Not ranked.

67% Complete

Additional Information and Questions

Which of the potential transportation investments will support the livability and economic health of future generations? Your answers to these more detailed questions will help inform how the County approaches further exploration of the investments.

Click the tabs below to learn more...


Programs to Reduce Vehicle Trips

The study found that policies and programs that discourage driving alone and that encourage biking, walking, and transit use at residential and employment centers can increase non-auto use by 50% and reduce the number of vehicles on the roads, especially during hours when congestion is worst. Pricing, either through tolling new lanes on freeways or implementing new road-user charges, could reduce hours traveled by 15% or more, if implemented with higher charges at peak periods.

Which of these options would you support exploring further to manage demand?

Parking management and transit, bike, walk incentives in mixed use and employment centers. (Check one.)
Add a toll to new lanes on freeways with higher charges at peak periods. (Check one.)
Road User Charges based on per mile traveled with higher charges for peak travel periods. (Check one.)
Ridesharing programs to promote carpools. (Check one.)
Telecommuting and teleconferencing. (Check one.)

You may answer additional optional questions by clicking the topic areas on the left, or continue to the Next Steps page.

Smart Technology

Increased communications, computing power and use of sensors is being applied to vehicles, infrastructure and transportation systems to create new efficiencies and opportunities, including improved safety, better customer service, enhanced mobility and more reliable travel.

Self-driving cars could theoretically travel more closely together than today’s cars, allowing more cars to use the same road, reducing crashes and related delays. Because self-driving cars could reduce congestion on roads, this may simultaneously encourage people to drive more as roads open up. The study found that, if self-driving cars increase the capacity of the roads by 20%-40%, delay could be reduced by 11%-22%, but the total number of vehicle miles driven could increase by up to 55%-155%.

How strongly do you support the following statement?

"We should explore ways to use safer and more efficient smart technologies to reduce the need for widening or building new roads." (Check one.)

You may answer additional optional questions by clicking the topic areas on the left, or continue to the Next Steps page.

Enhanced Transit

The study found that the demand for transit in Washington County could increase almost three-fold in the next 40-50 years. With planned service improvements and future growth, almost 80% of the households in the County will be located within a quarter-mile mile of transit service.

The study also found that:

  • Portland will continue to be the most significant transit market for trips to and from Washington County. Transit trips to Portland will more than double by 2055.
  • Light rail trains would need to run every six minutes or better in both the US 26 and the I-5 corridors to meet demand at peak load points.
  • By providing faster light rail service and more park and rides, demand for transit could increase up to 20% more between Hillsboro and Portland.
  • Buses will experience the same congestion levels as other cars and trucks on the road, unless investments are made that prioritize buses.
  • An Increasing, but smaller, demand is expected from Marion, Columbia and Yamhill counties.

Which of the following would you support exploring further to meet the county’s increasing transit demand?

Completing planned bus services to provide access with quarter-mile to most households in the urban areas. (Check one.)
More frequent bus service on major routes with more convenient transfer points between routes. (Check one.)
Give buses priority at intersections on major roads so they can pass up vehicles. (Check one.)
Separate lanes for buses. This could mean reducing an auto lane if right-of-way is not available to build a bus-only lane. (Check one.)
More trains on MAX to meet future transit demand, maintain reliability and avoid overcrowding. (Check one.)
Express MAX service between Hillsboro or other cities and downtown Portland. (Check one.)
Extend WES to Salem and improve transit connections to Yamhill, Columbia and Clark counties. (Check one.)
Improved station access with more park-and-ride or shuttle connections. (Check one.)

You may answer additional optional questions by clicking the topic areas on the left, or continue to the Next Steps page.

Enhanced Bicycle & Walking Infrastructure

The study found that bicycling and pedestrian trips could double by 2055 as the urban areas develop and that about 80% of the County’s households would be within a quarter-mile from bicycle lanes and sidewalks when improvements on collectors and major roads are completed. However, increased traffic congestion could make bicyclists and pedestrians (the most vulnerable users of the roads) feel less safe.

Which of the following bicycle/pedestrian improvements would you support exploring further?

Complete bike lanes and sidewalks on all major roads and collectors, providing access to about 80% of the county's urban households within ¼ mile. (Check one.)
Build protected bikeways on major roads with the highest traffic volumes to increase safety. (Check one.)
Construct a network of off-road facilities, using the trail network and other new connections. While not as direct or accessible, they would provide separation from vehicle traffic. (Check one.)
Fully institute safety features and amenities for bicycles and pedestrians, such as bike racks, signals in mixed use and employment areas and slower traffic speeds in city centers. (Check one.)

You may answer additional optional questions by clicking the topic areas on the left, or continue to the Next Steps page.

Enhanced Arterial Network

The study found that many arterials, especially north-south roads in the rural area, would be over capacity by 2055. Focusing investments to enhance the arterial network could improve safety and alleviate some congestion. However, new right-of-way to widen roads can reduce land development potential in urban areas and conflict with agricultural practices in rural areas, but less than for right-of- way with new roads.

The study also found that:

  • Expansion of existing arterials, such as Roy Rogers Road and Cornelius Pass Road, can help traffic flow but will not add capacity to meet all traffic demand.
  • New arterial connections, such as connecting arterials for a route around Cooper Mountain between Roy Rogers Road and Cornelius Pass Road south of TV Highway could reduce traffic volumes on adjacent arterials, such as 175th, up to 20%, allowing other arterials to serve a more localized function.
  • Additional design treatments, access management and passing lanes on Highway 219, Cornelius Pass Road and other roads could improve safety but are likely to have little impact on reducing delay.
  • Slower traffic speeds, more crossings, sidewalks and other amenities in mixed use centers areas with high pedestrian traffic can promote walkability, improve safety and support community goals but reduce vehicle capacity through these areas.

What additional arterial improvements would you support exploring further?

Restrict driveway access and reduce the number of intersections on key arterials, like TV Highway, to improve traffic flow and safety. (Check one.)
Expand existing arterials with additional vehicle lanes to meet future demand. (Check one.)
Connect existing arterials with new arterials, such as around Cooper Mountain, to reduce traffic loads on other roads. (Check one.)
Reduce traffic speeds and improve amenities for walking and biking on arterials in mixed use centers. (Check one.)

You may answer additional optional questions by clicking the topic areas on the left, or continue to the Next Steps page.

New Roadways

The study found that demand for freight access to the Portland Airport and other points north will continue to increase, and that demand for north-south roads between the I-5/Wilsonville area and US 26 near Hillsboro would be over capacity by 2055.

The study also found that:

  • A new “northern connector” between US 26 and Hwy 30 with a new bridge across the Willamette River to Columbia Blvd would attract 60% of the trucks traveling on US 26 through the tunnel, shorten the truck trip and improve access for trips to the industrial areas and I-5 North and reduce traffic on Cornelius Pass and Germantown roads.
  • A new limited access roadway between US 26 at Hillsboro and I-5/I205 at Wilsonville would reduce vehicle delay and shift traffic from other roads, such as TV Hwy, Hwy 219, and local roads, allowing use of these existing roads for agricultural and local traffic. Traffic demand is higher for the roadway located within a more urban area than for a western location in the rural area.
  • Faster speeds on the new roadways would increase vehicle trips and increase safety risk. Construction for new roadways would increase environmental impacts with 800 acres of roadway through natural, agricultural and developed communities.

Which new roadway investments would you support exploring further?

Build a new "northern connector" roadway between US 26, US 30 and Columbia Boulevard. (Check one.)
Build a new limited-access roadway through the rural area with less impact on urban areas between US 26 and I-5. (Check one.)
Build a new limited-access roadway through the existing urban areas with less impact on rural areas between US 26 and I-5. (Check one.)

You may answer additional optional questions by clicking the topic areas on the left, or continue to the Next Steps page.

New Freeway Lanes

The greatest traffic delays are expected on freeways (I-5, US 26, I-205, and Highway 217) due to the high traffic volumes and congestion. The study found that adding lanes and restricting use of the lanes can help, but more aggressive restrictions would be needed to manage demand.

The study found that:

  • Adding a lane in each direction on these freeways (I-5, US 26, I-205, and Highway 217) and managing these lanes for trucks, buses and high occupancy vehicles (HOV) could reduce delay for general purpose traffic by up to 15% due to the added capacity and up to 50% for trucks due to the exclusive truck lanes.
  • However, added capacity would be readily consumed by additional vehicle traffic and freeways would remain congested, though traffic on parallel arterials would be reduced.

  • Faster speeds with the added lanes would increase the total number of vehicle miles traveled, increase crash risk and could contribute to greenhouse gas emissions, unless mitigated by safer and cleaner vehicles.

Which new freeway lane investments would you support exploring further?

Aggressively manage new lanes by charging a variable toll for express travel (i.e., it would cost more to use the managed lane during rush hour). (Check one.)
Manage new lanes to allow only trucks carrying freight, buses and high occupancy vehicles (HOV) to use the additional capacity. (Check one.)
Widen freeways for general purpose traffic, without any management of traffic priority. (Check one.)

You may answer additional optional questions by clicking the topic areas on the left, or continue to the Next Steps page.

83% Complete

Tell Us About You

Thank you for visiting this online open house. We hope that you continue to stay involved in the Study:

  • Sign up for our mailing list below to receive Study updates.
  • Provide comments anytime on the project website: WCTransportationFutures.org.

Although new comments are no longer being collected through this online open house, you are welcome to submit feedback using the project website.

Final Questions

Do you live in Washington County? (Check one.)
Do you work or go to school in Washington County? (Check one.)
How long is your typical one-way commute to work or school? (Check one.)
How do you most often commute to work or school? (Check one.)
What other ways do you commute to work or school? (Check all that apply.)
How did you hear about this online open house? (Check all that apply.)

Mailing list (Optional)

Provide the following optional contact information if you would like to be added to the project mailing list.

Demographic Information (Optional)

This study is requesting demographic information to evaluate the effectiveness of public outreach activities. The identity of individuals is kept confidential. The results are reported as totals only, and used solely to help improve future community engagement. Providing this information is voluntary and optional.

With which gender do you identify? (Check one.)
What is your total annual household income? (Check one.)
What languages do you speak at home? (Check all that apply.)
What is your race/ethnicity? (Check all that apply.)
100% Complete