This site is currently closed to new comments, however you can continue to follow the project and submit comments though the project website.
Visit the pages on this site using the buttons below or click "Get Started" above to move through the information in order.

= Page includes questions or opportunities for comment.


Project Purpose
The purpose of the Main Street Safety Project: Planning Phase is to select infrastructure solutions that will make Main Street safer for people walking, biking, driving, and taking transit.
The selected safety improvements will provide for the movement of goods and people, support the economic viability of the corridor, accommodate current bus service and future transit solutions, and complement tra ffic safety education and enforcement.
The Main Street Corridor Vision Plan, ODOT’s 2011 Safety Study, the Pedestrian Crossing Project and the Main-McVay Transit Study are some of the building blocks of this project, and coordination between projects is a key part of our planning phase.
Why is this important?
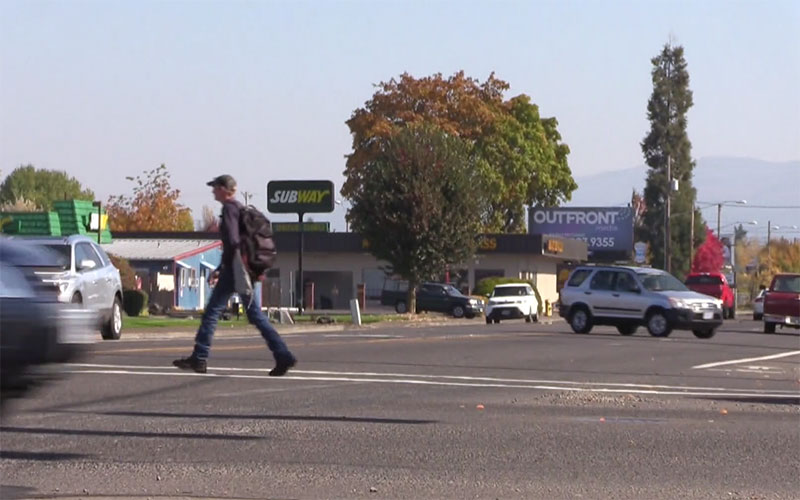
- Safety – Main Street is consistently ranked among the most unsafe streets in Oregon for people walking, biking, driving, and taking transit.
- Main Street is the heart of our city – It is a key east-west street, an economic engine in the heart of Springfield, and a major transit route.
- A major transit corridor – Main Street is one of the most heavily used transit routes in Lane County.
- A healthy and safe Main Street for all – Improvements are needed to ensure safe, accessible transportation for everyone, whether by foot, bike, mobility device, bus, or car.
Project Area
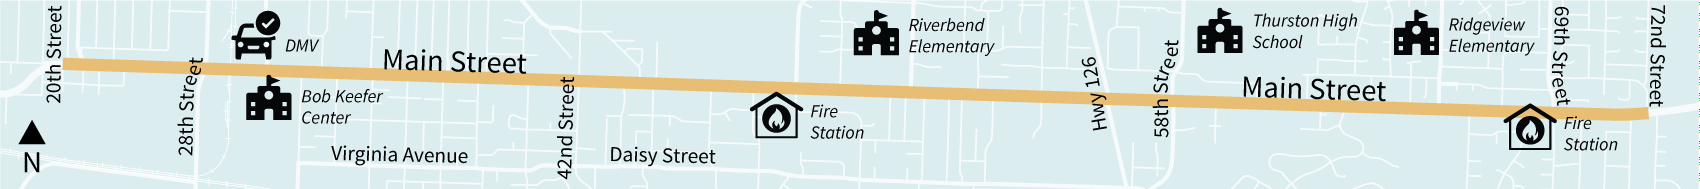
Click to enlarge.


Crash History and Trends
The project team analyzed the most recent five years of reported crashes between 2012 and 2016, both along the corridor and at key intersections on Main Street.
- 653 reported crashes occurred in the vicinity of Main Street between S. 20th and S. 72nd.
- 24 crashes – just 4% of all crashes – resulted in fatal or severe injuries, while nearly half resulted in property damage. (Figure 1.)
- 20 pedestrian-involved crashes and 26 bicycle-involved crashes were reported. But these numbers might not reflect the actual number of crashes involving cyclists and pedestrians – it’s common for less severe crashes to go unreported.
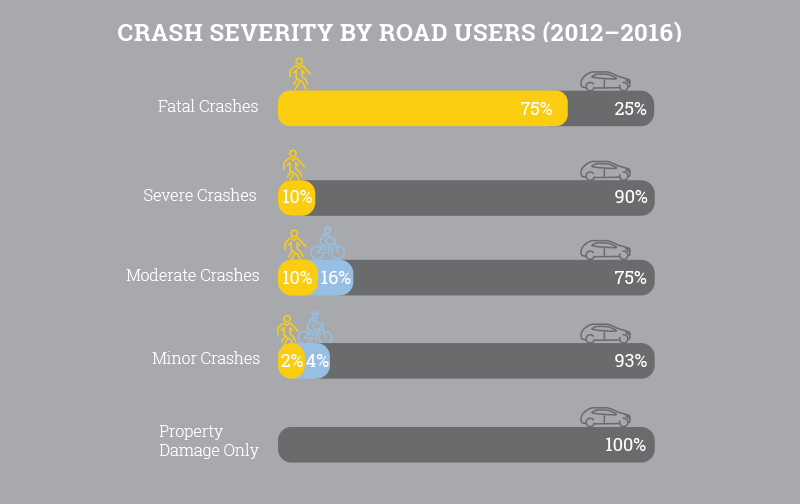
- Pedestrians accounted for most of the fatal crash victims, while vehicle passengers made up the majority of severe injury crash victims. (Figure 2.) While pedestrian-related crashes comprise only 3% of all corridor crashes, they make up 75% of fatal crashes and 10% of severe injury crashes.
Contributing Factors
The project team studied the crash data to help identify the common factors contributing to crashes on Main Street.
- Over 80% of crashes along the corridor were classified as rear-end or turning movement crashes. These types of crashes are common on corridors with a high density of driveways and intersections, such as Main Street.
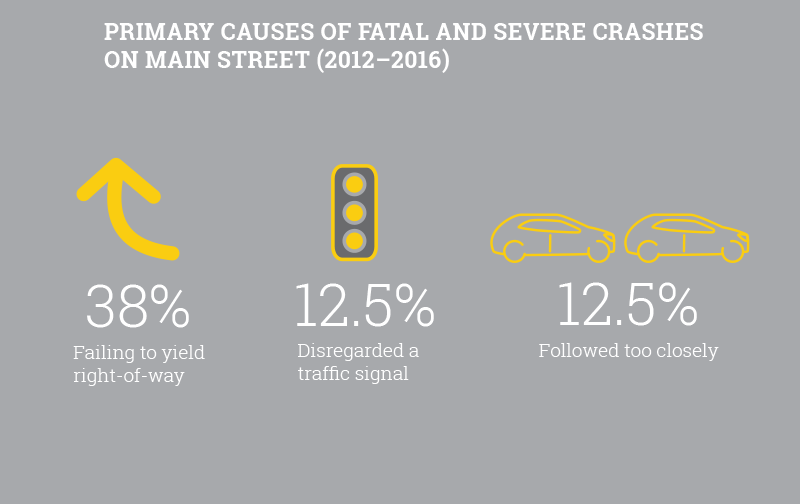
- The factors most commonly reported in fatal and severe crashes were failing to yield right-of-way (38%), disregarding a traffic signal (12.5%), and following too closely (12.5%). (Figure 3.)
- Impairment (drugs or alcohol) contributed to just over 5% of the total crashes on Main Street but contributed to 12.5% of fatal or severe injury crashes.
Most Frequent Crash Locations
The team evaluated the number, type, and severity of crashes on Main Street and compared them to crash trends on streets with similar characteristics. The intersections and segments with a higher than expected number of crashes (Figure 4) are:
- 28th Street
- 30th Street
- 32nd Street
- 41st Street
- 42nd Street
- 54th Street
- 36th Street to 41st Street
- 41st Street to 42nd Street
- 42nd Street to 48th Street
- 51st street to 54th Street
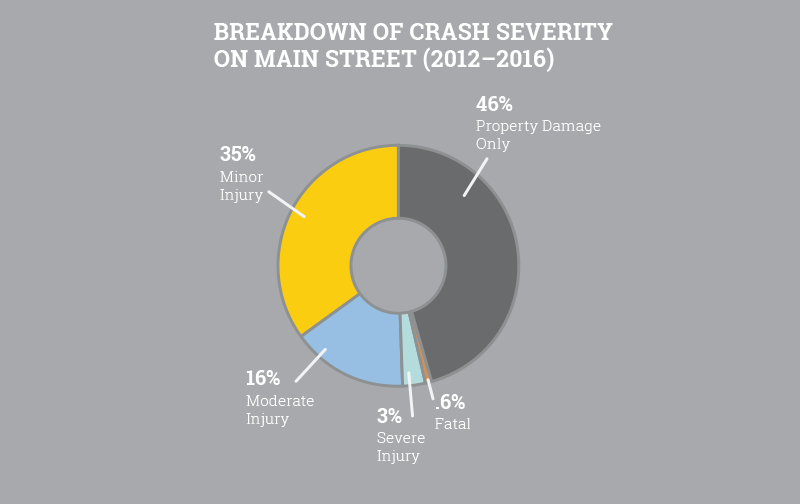
Figure 1: The analysis identified the severity of the reported crashes. 24 crashes – just 4% of all crashes – resulted in fatal or severe injuries, while nearly half resulted in property damage. (Click to enlarge.)

Figure 2: The analysis showed that pedestrians accounted for most of the fatal crash victims, while vehicle passengers made up the majority of severe injury crash victims. (Click to enlarge.)

Figure 3: What contributed to the fatal and severe injury crashes? The factors most commonly reported in fatal and severe crashes were failing to yield right-of-way, disregarding a traffic signal, and following too closely. (Click to enlarge.)
Most Frequent Crash Locations (2012-2016)
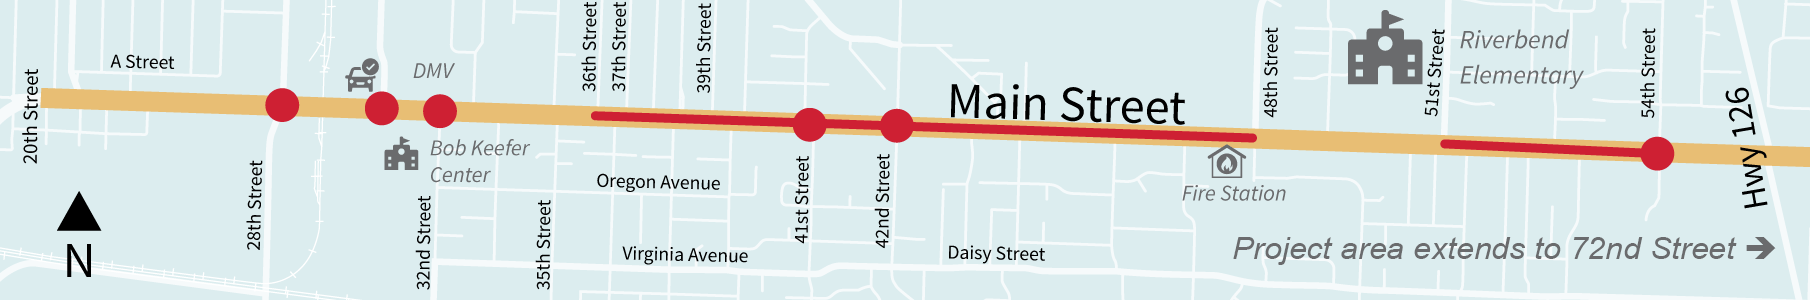
Figure 4: The team evaluated the number, type, and severity of crashes on Main Street and compared them to crash trends on streets with similar characteristics. The intersections and segments with a higher than expected number of crashes are shown on the map. (Click to enlarge.)
Questions
Consider the following list of community values. Which are the most important to you?
Use the sliders to divide 21 points between the values listed below. You can assign up to 6 points in each category. Where would you put the most points? If you run out, you can shift points between categories until you are satisfied with the balance you achieve.
SafetyI value solutions that reduce risk of fatalities and serious injuries. |
0 |
Traffic MobilityI value solutions that minimize congestion and maintain the flow of traffic. |
0 |
Local Business AccessI value solutions that support the viability of the businesses on Main Street by providing access and minimizing other impacts. |
0 |
Main Street CharacterI value solutions that improve the appearance of Main Street and make it a vibrant place for those who live, work, shop, and travel through the corridor. |
0 |
TransitI value solutions that support reliable and frequent transit service that is accessible from destinations along Main Street. |
0 |
CostI value solutions that are cost-effective and make good use of public funds. |
0 |
Total Spent: 0/21
Comment Wall: Do you have other values you believe should be considered as we develop and evaluate potential solutions?
characters remaining.
Read other comments...
Instructions
- Click Add Comment to show options for placing a comment on the map. (At smaller screen sizes, click "Map Options" to show the comment button.) Once submitted, your comment will appear with an icon.
- Read comments by clicking icons on the map.
- Use Find a Place to search the map for streets or destinations.
- Use the map controls to zoom in and out and change the map type between roadway and satellite.
- Click Reset to restore the map view.
Possible issues...
Important destination Frequently visited places, or places that are important to access. | |
Lighting and visibility Locations where it is difficult to see because of obstructions or poor lighting. | |
Vehicle speed Locations where vehicle speeds feel unsafe. | |
Difficult crossing Locations where it is difficult for pedestrians and cyclists to cross Main Street. | |
Unsafe location Locations that feel generally unsafe for travel, or where you have experienced vehicle conflicts or near misses. | |
Property access Locations where it is currently difficult to turn into or out of businesses and residences. | |
Other comments Locations with other types of issues or concerns not described above. |
The Enhanced Corridor Option
The transit study’s community outreach and technical analysis indicate the most viable transit mode for Main Street at this time is Enhanced Corridor. EmX remains a possibility depending how development, traffic volumes, and funding opportunities change over the next 10 to 30 years. Based on input received in response to the question below, LTD and the City will identify key transit improvements in coordination with other transportation improvements identified in the Main Street Facility Plan.
What is an Enhanced Corridor?
Enhanced Corridor is a term that describes a collection of moderate capital investments that will improve transit reliability, speed, capacity, and passenger comfort for less expense than EmX.
Enhanced Corridor investments on Main Street could include:
- Transit queue jumps (a special lane and signals for buses to “jump” ahead of other traffic at intersections with congestion delays);
- Better amenities at ground-level stops (such as trash receptacles, benches, shelters, automated fare collection);
- Consolidating stops to 1/3-mile spacing (provides faster, more reliable service and may attract more riders through improved travel times and stop amenities); and
- Deploying different sized buses – 40 to 60 foot – to accommodate fluctuations in peak and off-peak ridership.
An Enhanced Corridor on Main Street would NOT include:
- EmX Stations; and
- Exclusive transit-only lanes east of 20th (except possibly at major congested intersections).
.

Transit improvements will be coordinated with other improvements identified in the Main Street Facility Plan.
Question
Stay Involved
- Check our website (mainstreetsafety.org) and sign up for email updates.
- Watch for a series of upcoming meetings for residents, business owners and property owners (posted on our website).
- Contact our team for more information:
Molly Markarian, City of Springfield
info@ourmainstreetspringfield.org, 541-726-4611
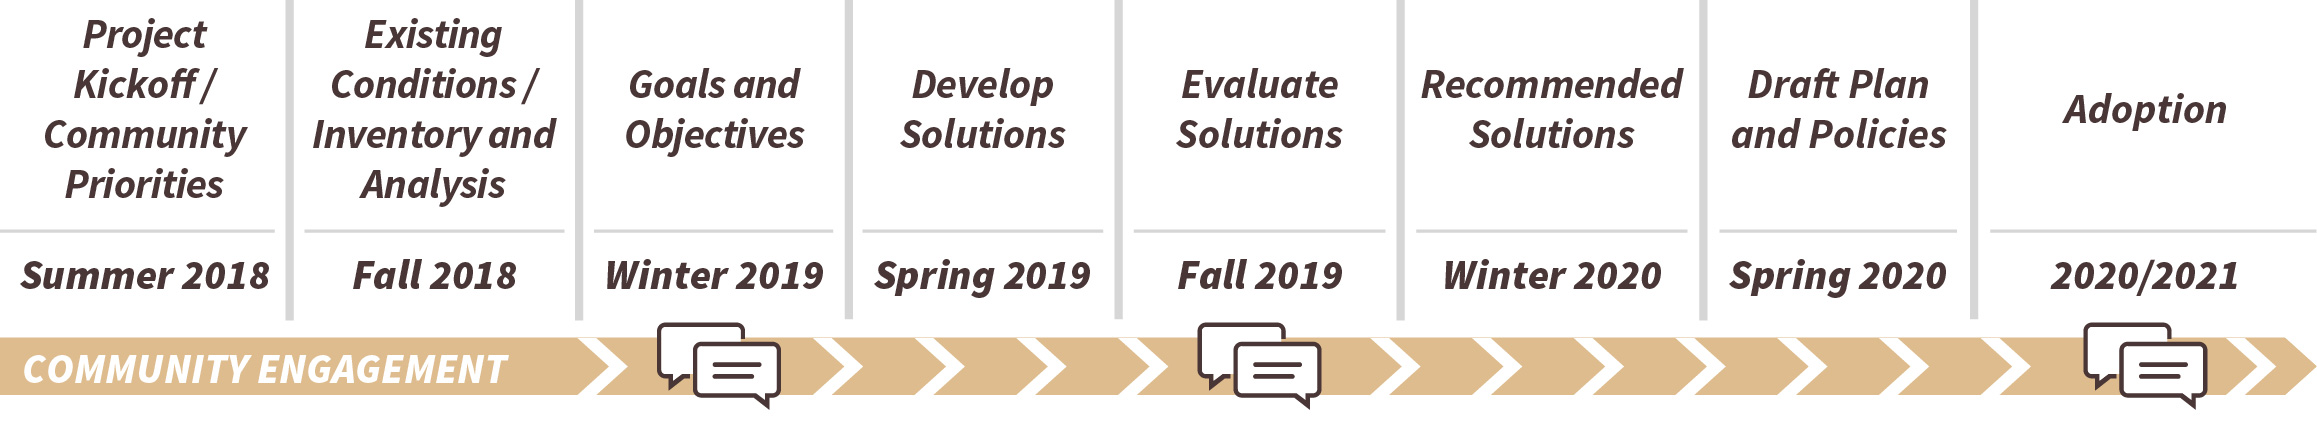
Target Schedule
Final Questions
(All of questions are optional.)
Demographic Information (Optional)
By answering the optional questions below, you can help us know whether we reached a representative cross-section of the community.
