You may go directly to a station using the buttons below, or click the Get Started button at the top of the screen to move through the stations in order.
Stations
Why are we doing this?
- The Plan is part of a set of statewide policy plans, all under the Oregon Transportation Plan, that establish a vision and policy framework for decision making.
- This update will ensure that Oregon’s safe transportation strategies are keeping pace with current challenges to our transportation system. This update will also help focus safety efforts on the factors that contribute most to our transportation-related fatalities and serious injuries, while encouraging safety programs and practices that address other significant safety problems. This is consistent with federal guidelines.
Who is doing this?
- This plan is for all of Oregon. Its development is being led by the Oregon Department of Transportation with significant involvement from stakeholders, including the Policy Advisory Committee, which is made up of a diverse set of participants. The PAC's recommendations will go to the Governor-appointed Oregon Transportation Safety Committee and the Oregon Transportation Commission, which are ultimately responsible for adopting the plan.


Crash History and Trends
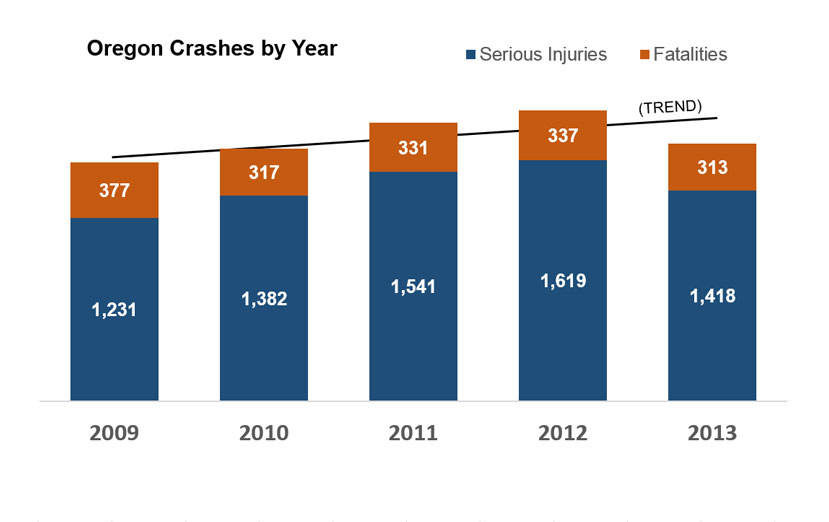
This study began by looking at crash data collected from all public roads in Oregon as recorded in crash reports recorded by law enforcement from 2009 to 2013 (the most recent complete year available when the team prepared the assessment). The study did not consider unreported crashes or crashes that did not result in fatalities or serious (life-changing) injuries.
- The study found a general trend of increased serious injuries during the study period. (Note: In 2011 there was a change in how injuries were recorded and this resulted in what appears to be a higher than normal increase for the injury numbers that year, though the actual increase is not as high. The way fatal crashes were counted was not affected.)
- Fatalities decreased in the study period, from 377 in 2009 to 313 in 2013. However, recently released information reveals an increase over the last two years.
Contributing Factors
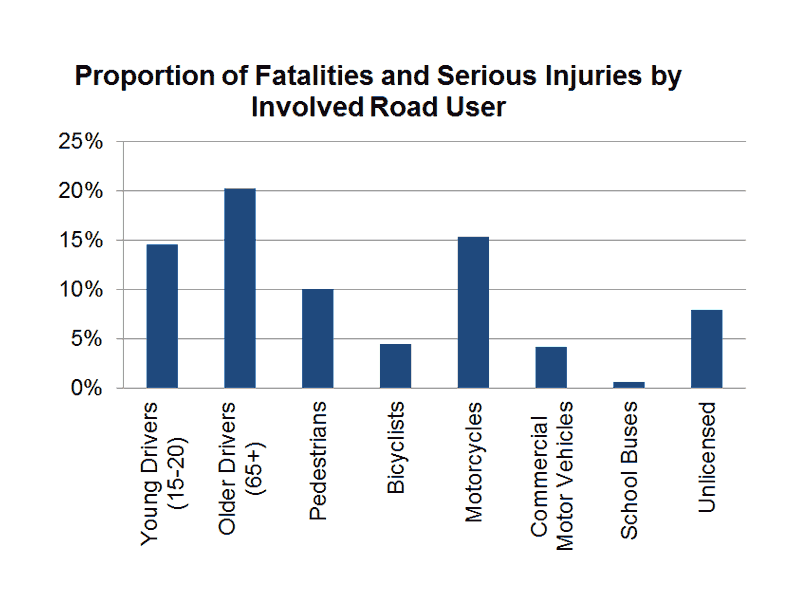
The project team studied a number of different crash categories to help identify which were the most contributors to Oregon's crashes:
- Who was involved or most likely to be hurt? Older drivers (aged 65+), motorcyclists, and younger drivers (aged 15-20) are the groups most commonly involved in fatal or serious injury crashes.
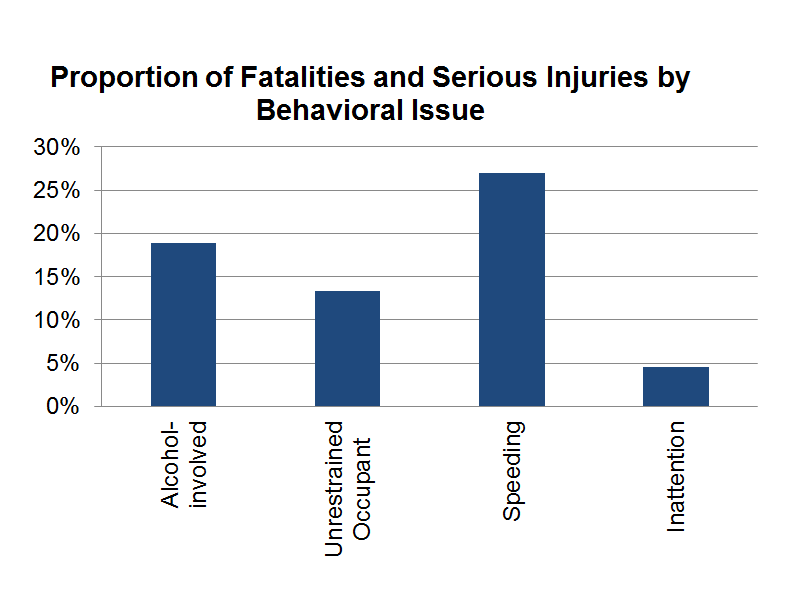
- Why did the crash occur? Why did it result in a fatal or serious injury? Speeding (or traveling at speeds unsafe for the conditions), alcohol, or occupants not wearing seatbelts were the most common factors involved in fatal or serious injury accidents.
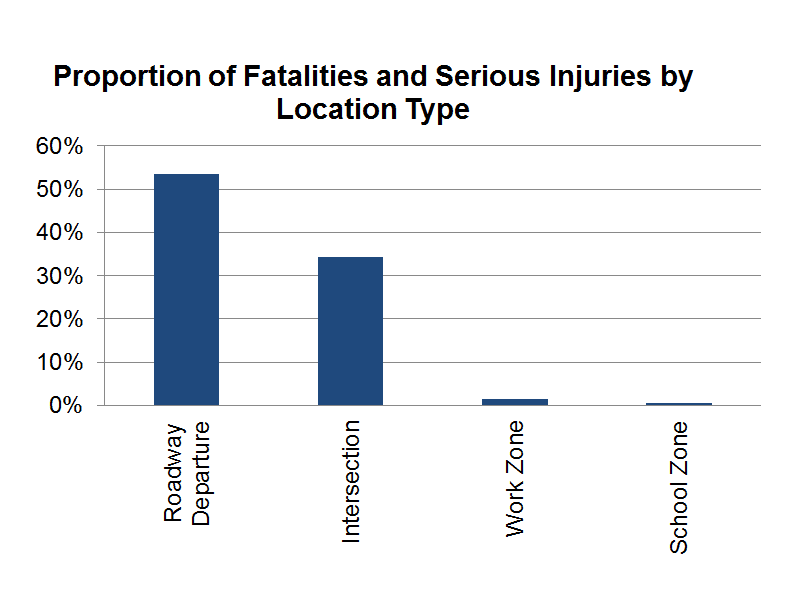
- Where did the crash occur? Roadway departure (vehicles leaving the road or crossing into other lanes) and crashes at intersections were the main locations where fatal and serious injury crashes occurred.
Frequency and Severity
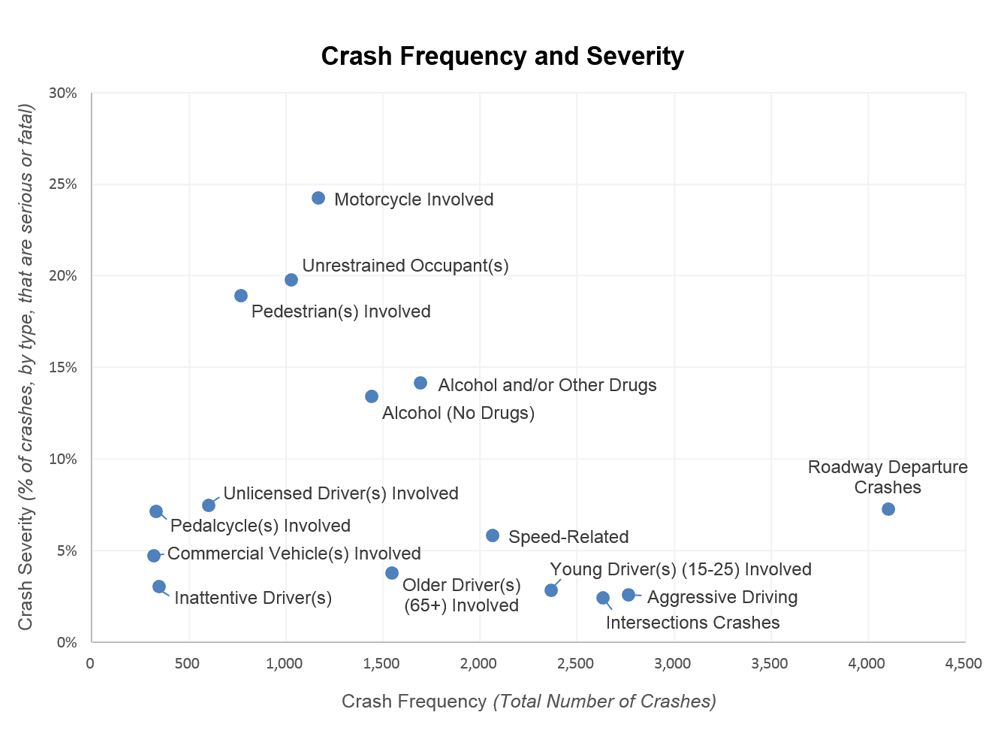
The most serious crash categories were charted as a function of frequency and rate of severity crashes. This data is helpful in assessing the significance of different crash categories. For example:
- Intersection-related crashes are among the most frequent crash types in the state; however, the severity rate of intersection crashes is relatively low. Only 2% of all intersection-related crashes have a fatal or serious injury.
- On the other hand, Motorcyclists involved crashes are approximately half as frequent as intersection crashes, but have the highest severity rate of all crash types in the state. Nearly a quarter (24%) of all motorcycle crashes involve a fatality or serious injury.
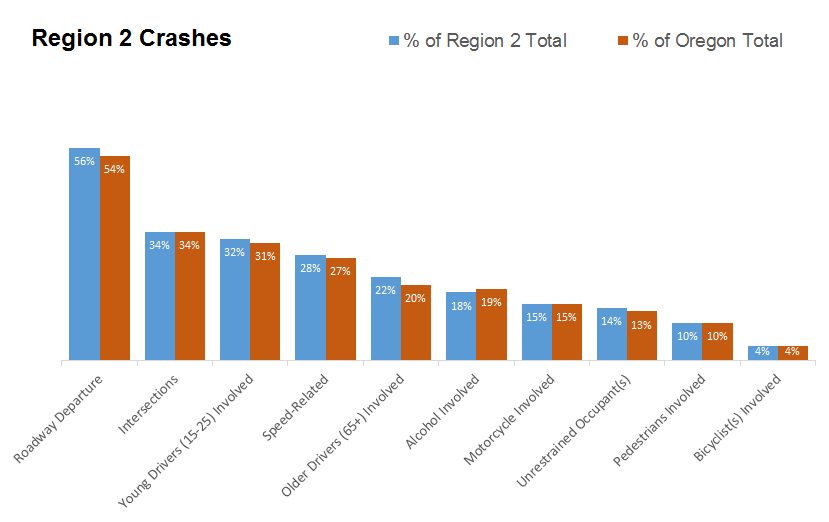
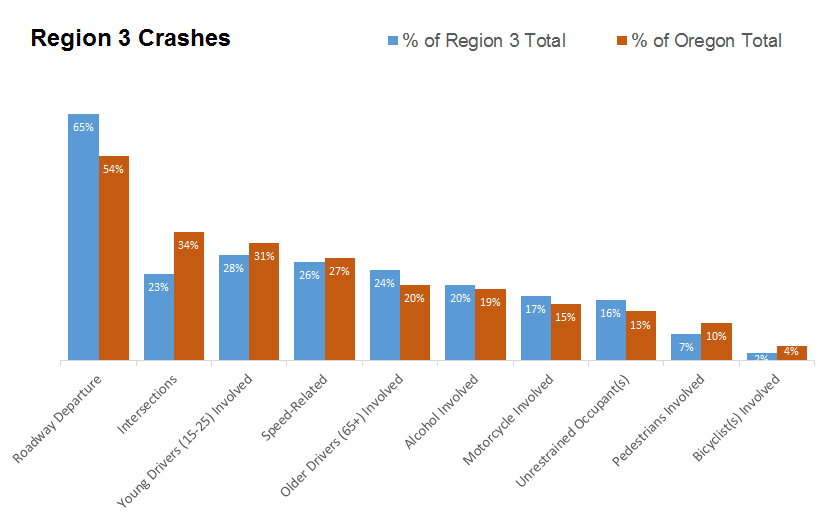
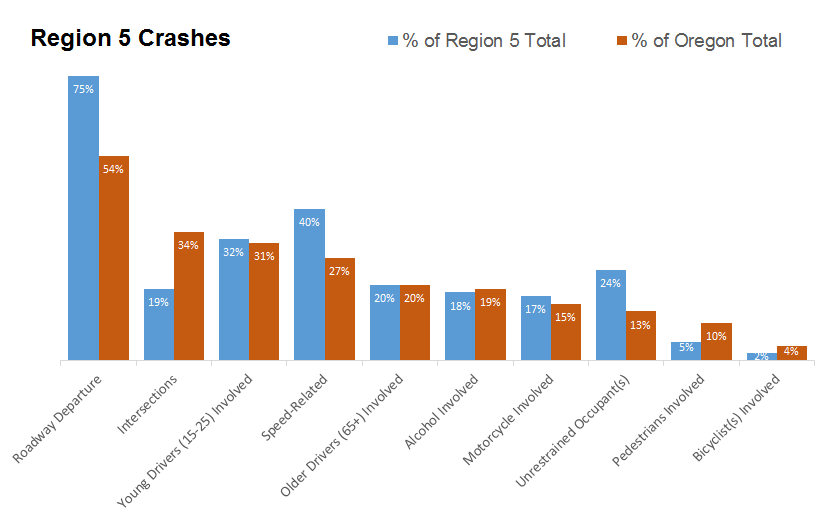
Crashes by Region
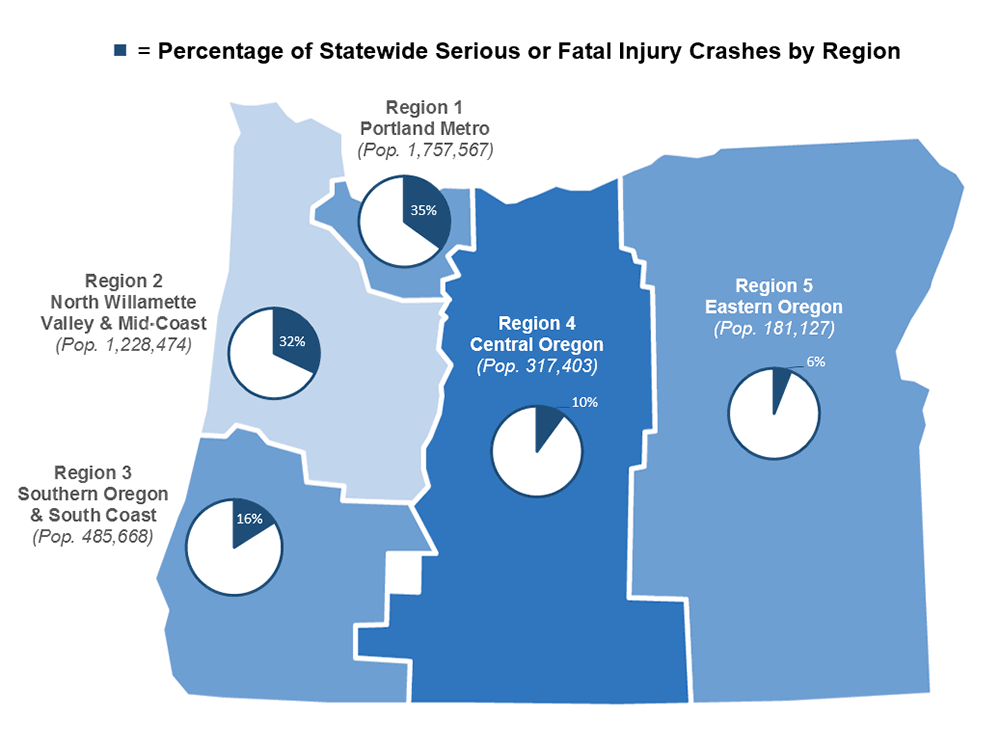
While the crash types and contributing factors are largely the same across the state, there are regional differences in the distribution of crashes:
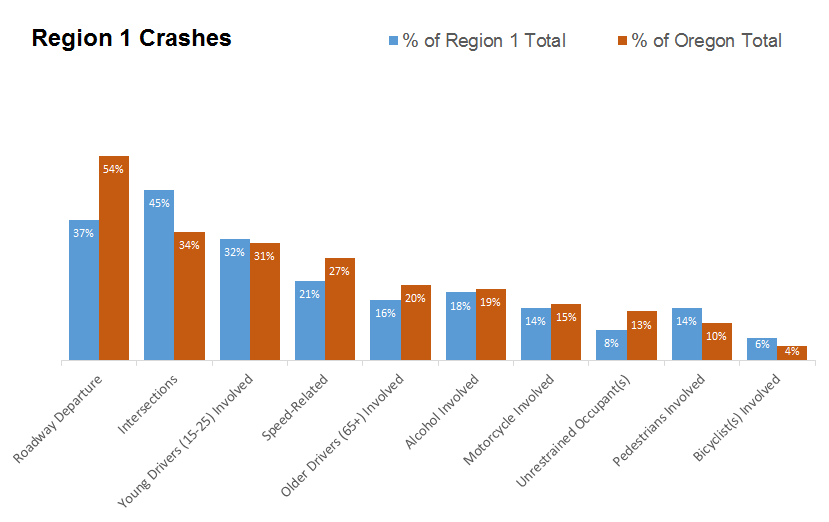
- Region 1 ( Portland Metro Area) has a higher number of fatal and serious injury crashes at intersections and crashes involving pedestrians; it has comparatively fewer crashes relative to the rest of the state related to roadway departure, speed, older drivers, and unrestrained occupants.
- Region 2 (northern Oregon Coast and southern Willamette Valley) closely follows the statewide averages, with roadway departure, intersections, and speeding as the most common contributing factors to crashes.
- Region 3 (southwestern Oregon), Region 4 (central Oregon), and Region 5 (eastern Oregon)are similar in having higher frequency of roadway departure and speed-related fatal and serious injury crashes as compared to the statewide average.
About the Vision, Goals and Policies:
Early last year we asked people from throughout Oregon to tell us about their key transportation safety issues. Since then, the project team has worked with a Policy Advisory Committee to shape those issues into a Vision, as well as Draft Goals, Policies and Strategies to achieve that Vision. These will shape decisions as we plan for and invest in our transportation system.
What we want to know:
Are the Goals on the right track? Are the policies and strategies to achieve the goals appropriate? Click through the tabs below to read the goals, then give us your feedback at the bottom of this page. To see the initial strategies, click on a policy.
(Click the policies below to show potential strategies.)
Policy 1.1 - Promote safety culture within agencies, stakeholder organizations and employers.
- Strategy 1.1.1 - Provide transportation leaders and staff with training, information, and education on proven methods to integrate safety into all aspects of the planning, programming, project development, construction, maintenance and operations processes.
- Strategy 1.1.2 - Implement best practices for ongoing enhancement of safety culture training, information and tools within ODOT and across agencies and stakeholders.
- Strategy 1.1.3 - Conduct program planning, implementation and evaluation to address behavioral and health related transportation safety.
- Strategy 1.1.4 - Coordinate and collaborate with public and private employers to implement work related transportation safety programs.
Policy 1.2 - Communicate proactively with system users about safety culture.
- Strategy 1.2.1 – Promote safe travel behavior through educational initiatives in collaboration with state, county and local transportation agencies , private sector interests, media organizations, and transportation and safety interest groups. Focus on how system user behavior can contribute to a safer transportation system for all users.
- Strategy 1.2.2 – Tailor safety culture marketing and media tools to specific user groups with specific needs (e.g., youth, older travelers, walkers, bikers, minority groups and different income groups).
- Strategy 1.2.3 – Evaluate the safety effectiveness of educational activities for agency, public and stakeholder perceptions about safety culture.
Policy 1.3 - Implement regulatory changes including legislative concepts and administrative rule changes as needed to provide incentives or remove impediments to developing a multimodal transportation safety culture.
- Strategy 1.3.1 - Collaborate with state, regional, and local transportation and safety agencies, and other stakeholders, to identify walking, biking, or driving behaviors which could be addressed through legislation. Identify and pursue legislation to modify these behaviors.
(Click the policies below to show potential strategies.)
Policy 2.1 – Continually improve safety data collection, management and distribution for data-driven decision making for infrastructure planning, development and operations activities, across all divisions at ODOT, and with partner agencies and stakeholders.
- Strategy 2.1.1 – Develop a strategic plan for safety data enhancement and sharing that integrates the findings and needs of a strategic safety data plan with other strategic data planning efforts at ODOT and supports safety analysis across all divisions at ODOT and with partner agencies and stakeholders.
- Strategy 2.1.2 – Identify and implement new methods for crash, roadway and exposure (e.g. vehicle, pedestrian and bicycle volume) data collection, sharing, and storage.
- Strategy 2.1.3 – Support national safety research and lead state and local research to identify opportunities to enhance data analysis techniques and test countermeasures to reduce crash frequency or severity.
- Strategy 2.1.4 – Reseach and consider new methods to improve safety data availability and access to other agencies and safety provider as well as the public as appropriate.
Policy 2.2 – Continually improve and implement analysis techniques for safety-related decision making in transportation planning, programming, design, operations and maintenance for all modes.
- Strategy 2.2.1 – Update manuals, guides, processes and procedures, etc. to include quantitative safety analysis in planning, project development and design, programs and maintenance activities to include using predictive methods and tools.
- Strategy 2.2.2 – Include safety benefits in ODOT project prioritization processes.
- Strategy 2.2.2 – Implement planning, program, and project-level performance measures and/or indicators to monitor safety outcomes on all public roads for all modes.
Policy 2.3 - Plan, design, construct, operate and maintain the transportation system to reduce fatalities and serious injuries for all modes.
- Strategy 2.3.1 – Implement Practical Design and/or other proven and exploratory approaches to reduce roadway departure and intersection crash frequency and severity.
- Strategy 2.3.2 – Ensure design standards fully consider both design and desired operating speed in order to achieve planned transportation system safety outcomes.
- Strategy 2.3.3 – Implement best practices to minimize crash frequency and severity for all modes and all people in construction work zones.
- Strategy 2.3.4 – Implement best practices related to traffic incident management services to reduce secondary crashes and improve system operations and reliability.
- Strategy 2.3.5 – Include quantitative safety considerations in operations and maintenance decisions processes.
- Strategy 2.3.6 – Promote access management practices that improve system safety for all modes..
- Strategy 2.3.7 – Research and enhance enforcement and emergency medical service communications systems as feasible to improve response time and services for all travelers in Oregon.
- Strategy 2.3.8 – Promote roundabouts to improve safety.
- Strategy 2.3.9 – Continue to plan, design and implement best practices for rail safety program and systems management.
- Strategy 2.1.4 – Evaluate safety countermeasures for pilot projects and large scale implementation as appropriate..
Policy 2.4 – Implement regulatory changes including legislative concepts, administrative rule changes and updates to design standards, as needed to enable and/or remove impediments to new approaches to safety engineering as needed to enable and/or remove impediments to new approaches to safety engineering.
- Strategy 2.4.1 - Work with state, local and regional agencies to implement best practices in setting community speed limits.
- Strategy 2.4.2 - Work with state, local and regional agencies to evaluate and implement best practices for safety in school zones.
(Click the policies below to show potential strategies.)
Policy 3.6 – Plan for and design more livable and healthy communities with a focus on safe connections and movement for all modes and all ages.
- Strategy 3.6.1 – Coordinate and collaborate with local jurisdictions to identify community safety concerns and establish solutions through transportation planning, design, construction and maintenance..
- Strategy 3.6.2 – Educate transportation planning and design professionals on how to incorporate safer facilities and accommodations into community projects, using the concepts of context sensitive design.
Policy 3.1 – Advance coordination and collaboration between law enforcement and state, regional, and local transportation agencies, public health agencies and mental and physical health care providers to make communities safer places.
- Strategy 3.1.1 - Support a data-driven and high visibility enforcement program with approaches such as increased traffic, bicycle and pedestrian law enforcement capabilities (priority and funding) and use of data analysis to efficiently deploy enforcement resources to locations or corridors.
- Strategy 3.1.2 - Expedite traffic investigations to reduce traffic delays and to improve quality and timeliness of crash data.
- Strategy 3.1.3 - Expand culturally sensitive media, outreach, and communication for national and statewide education/enforcement campaigns.
- Strategy 3.1.4 – Expand law enforcement beyond standard traffic enforcement responsibilities to support improved community safety in activites such as delivering education classes on safer behaviors in schools, jails or detention centers.
- Strategy 3.1.5 - Conduct education and outreach to law enforcement to increase understanding and enforcement of traffic, commercial vehicle, pedestrian and bicycle laws.
Policy 3.2 - Support traffic enforcement funding to provide sufficient resources for officers to respond to incidents, increase levels of ongoing traffic enforcement, conduct focused enforcement, and participate in activities such as emphasis patrols.
- Strategy 3.2.1 - Identify community needs for funding and training to enhance traffic safety programs and enforcement.
Policy 3.3 – Support emergency medical service (EMS) funding to provide sufficient resources to train first responders and to respond to transportation related crashes and other medical emergencies fully equipped and in a timely manner.
- Strategy 3.3.1 - Identify community needs for funding and training to enhance EMS systems and improve response times and services. Recognize and address the differing needs of paid and volunteer providers.
Policy 3.4 – Invest in transportation system enhancements that improve safety and comfort for people while traveling in their community.
- Strategy 3.4.1 – Enhance perceptions of security by identifying and implementing appropriate facility design, lighting,and other changes to the built environment to improve personal security.
- Strategy 3.4.2 – Identify opportunities to improve transportation system security and safeguard critical infrastructure against natural and manmade disasters
- Strategy 3.4.3 – Facilitate communication and coordination between transportation agencies, EMS, and law enforcement on evacuation planning and emergency preparedness.
Policy 3.5 – Provide all regions and localities in Oregon with access to safety funding, resources, programs, and education based on local needs and issues, considering issues of equity.
- Strategy 3.5.1 – Explore methods to implement safety programs and funding equitably between urban and rural communities.
- Strategy 3.5.2 – Provide transportation safety educational opportunities for people of all ages and income levels.
- Strategy 3.5.3 – Support adequate funding for EMS particularly in rural and remote areas.
- Strategy 3.5.4 – Encourage implementation of Safe Communities statewide.
(Click the policies below to show potential strategies.)
Policy 4.1 – Actively monitor technological advances and plan, design, maintain and operate the system in a way that takes full advantage of opportunities to use technology to reduce crash frequency and severity.
- Strategy 4.1.1 – Explore and integrate, as feasible (considering potential economic, environmental, business, privacy etc impacts), technology to reduce crash frequency and severity, prioritizing implementation of technologies that address safety emphasis areas.
- Strategy 4.1.2 – Support research efforts that explore safety technology applications and testing.
- Strategy 4.1.3 – Prepare an implementation strategy for connected and autonomous vehicles in order to leverage the potential safety benefits associated with these technologies.
- Strategy 4.1.4 – Bring public and private sector stakeholders together to explore opportunities for applying technology solutions towards safety objectives, as well as to identify existing and potential future barriers to implementing new technologies. Consider potential economic, business, environmental, and privacy impacts of deploying technologies.
Policy 4.2 – Apply technological improvements in data management systems to enhance collaboration across agencies and provide tools for data collection and analysis to partner agencies and stakeholders.
- Strategy 4.2.1 – Provide leadership and staff support to statewide efforts to improve data availability, quality, and consistency across agencies.
- Strategy 4.2.2 – Support data strategic planning efforts to ensure safety data needs are considered and integrated.
- Strategy 4.2.3 – Develop tools to facilitate MPO, County and local agency data sharing and analysis.
Policy 4.3 – Leverage technology tools and best practices across divisions and agencies to strive for equitable deployment of useful technologies across the state and the transportation system.
- Strategy 4.3.1 – Develop statewide resources to share best practices, tools and training for statewide and systemwide deployment.
- Strategy 4.3.2 - Implement technology advances equitably between urban and rural areas with appropriate and context-sensitive measures.
- Strategy 4.3.3 - Explore methods to ensure that the safety benefits of technology are extended equitably to underserved system users and the transportation disadvantaged.
Policy 4.4 – Explore legislative concepts as needed to enable new approaches to technology focused on safety planning, engineering, enforcement, data management and analysis procedures.
- Strategy 4.4.1 – Support innovations in enforcement technology, such as innovations in field testing for alcohol and drug impairment testing in automated enforcement, and support legislation to enable its implementation.
- Strategy 4.4.2 – Review regulations that may impact the adoption of innovative technology and support appropriate new laws and/or amend administrative rules or standards that may constrain implementation of advanced technology.
(Click the policies below to show potential strategies.)
Policy 5.1 – Enhance publice awareness about the importance of transportation safety and the individual’s role in reducing crash frequency and severity.
- Strategy 5.1.1 - Work with the media to cultivate a safety culture message and work with and inform the public to promote a culture of safety. Ensure campaigns are sensitive to Oregon demographics.
- Strategy 5.1.2 – Develop consistent, culturally sensitive safety messaging that can be utilized across a variety of organizations, events, distribution media, and target audiences.
- Strategy 5.1.3 - Work with educators in the state’s public school system (including community colleges and other locations where transportation disadvantaged groups such as recent immigrants, newly-licensed adult drivers, ESL populations, etc. are likely to be found) to improve awareness and understanding of transportation laws and other information that supports a transportation safety culture. Ensure campaigns are sensitive to Oregon demographics.
Policy 5.2 - Increase transportation system providers and public and private stakeholder awareness of the TSAP and other safety policies to reduce crash frequency and severity.
- Strategy 5.2.1 - Develop a consistent internal (among partners and agencies) communication protocol for transportation safety topics.
- Strategy 5.2.2 – Evaluate agency awareness and implementation of safety activities through periodic statewide surveys.
Policy 5.3 – Ensure ongoing communication and coordination among transportation system providers and public and private stakeholdersthroughout the project development process and development and implementation of the TSAP.
- Strategy 5.3.1 - Engage ODOT Regions and Divisions, MPOs, ACTs, Tribes, Cities, Counties, thehealth and medical community, transportation services, enforcement and emergency medical service and traffic incident management providers in safety planning and implementation
- Strategy 5.3.2 - Integrate communications protocols with emergency medical service providers and make commitments for training on those protocols
- Strategy 5.3.3 - Identify joint legislative safety priorities amongst agencies and provide educational information to State legislators.
- Strategy 5.3.4 - Review crash report forms to ensure appropriate data is collected and extraneous data is eliminated. Provide training and education on resulting form.
- Strategy 5.3.5 - Promote sharing and leveraging of resources across programs, communities and agencies.
- Strategy 5.3.6 – Participate in federal rulemaking and guidance development programs to maximize opportunities to achieve the TSAP Vision.
(Click the policies below to show potential strategies.)
Policy 6.1 - Allocate infrastructure safety funds strategically across all modes and users to maximize total safety benefits.
- Strategy 6.1.1 – Continue to develop a quantitative, predictive, data-driven decision framework (including risk based assessments) to integrate safety measures into project prioritization and programming.
- Strategy 6.1.2 – Encourage the use of benefit cost analysis (or similar) in prioritizing safety projects.
Policy 6.2 - Allocate funding of behavioral and health safety efforts strategically across programs to maximize total safety benefits.
- Strategy 6.2.1 – Collaborate with mental and physical health care providers to leverage funding for behavioral related safety programs.
- Strategy 6.2.2 – Continue to develop a data-driven decision framework to integrate quantitative safety performance into behavioral related prioritization and programming.
- Strategy 6.2.3 – Identify funding needs to optimize emergency medical services and enforcement to minimize injuries post-crash.
- Strategy 6.2.4 – Evaluate effectiveness of behavioral safety programs to maximize benefits of safety investments.
Policy 6.3 - Identify and pursue opportunities to increase funding for strategic safety-related infrastructure, behavior and emergency medical service enhancements.
- Strategy 6.3.1 – Identify new sources of potential funding that can be dedicated and targeted to strategic investments that return greatest safety benefits.
- Strategy 6.3.2 – While complying with federal safety funding requirements and limitations, continue to promote opportunities to leverage funding sources in order to maximise safety benefits and outcomes.
- Strategy 6.3.3 – Use Practical Design techniques as appropriate to ensure safety funds for planning, design, maintenance and operations of infrastructure to achieve the broadest system benefits possible.
We want to know which Emphasis Area(s) will be most effective to address first in your community, and in the state as a whole.
Read about each Emphasis Area using the tabs below, and give us your feedback.
Stay Involved
- For further information, visit our website: www.oregon.gov/ODOT/TD/TP/Pages/tsap.aspx.
- Look for the Draft TSAP in early spring 2016. To receive notice of the final draft and public review period, sign-up for email alerts below.
Final Questions
Mailing list (Optional)
Provide the following optional contact information if you would like to be added to the project mailing list.
Demographic Information (Optional)
This project is requesting demographic information to evaluate the effectiveness of public outreach activities. The identity of individuals is kept confidential. The results are reported as totals only, and used solely to help improve future community engagement. Providing this information is voluntary and optional.
Oregon.gov
- State Directories
- Agencies A to Z
- Oregon Administrative Rules
- Oregon Revised Statutes
- About Oregon.gov
Oregon.gov Links
PDF File Accessibility
Adobe Reader is required to view PDF files. Click the "Get Adobe Reader" image to get a free download of the reader from Adobe.
About this site
This web site was developed by JLA Public Involvement and is not hosted by the Oregon Department of Transportation, though we adhere to the same accessibility guidelines. If you have any problems with the information on this page, please contact technical support, (503) 235-5881 for assistance.
