This online event provides information about the project and opportunities for comments. We invite you to explore this information and give us your feedback.
¿Hablas español? Ver información sobre las alternativas aquí.
Open House Stations
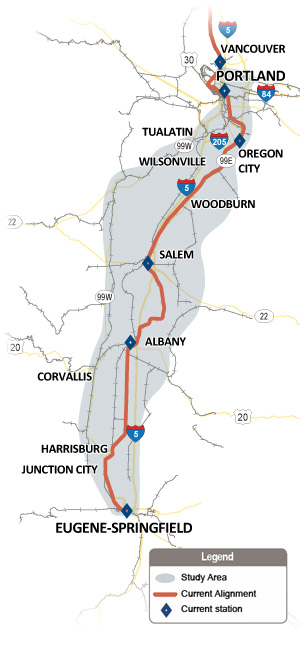
This area is part of the Pacific Northwest Rail Corridor, which extends from Eugene, OR to Vancouver, BC. It is designated as a regional high speed rail corridor, which means planning for top speeds of 90-125 mph.
The project team is currently conducting a National Environmental Policy Act (NEPA) environmental review process. The NEPA process ensures that the environmental impacts of potential projects are considered, and requires documentation and analysis of both negative and positive impacts.
This process will result in a Tier 1 Environmental Impact Statement (EIS) which will consider two build alternatives and also a No Action alternative. The Draft EIS considers:
- What service improvements should be used to improve frequency and speed
- What rail route should be used
- Which communities should have stations
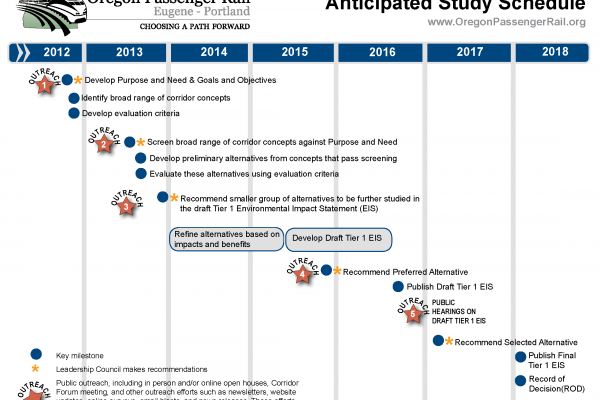
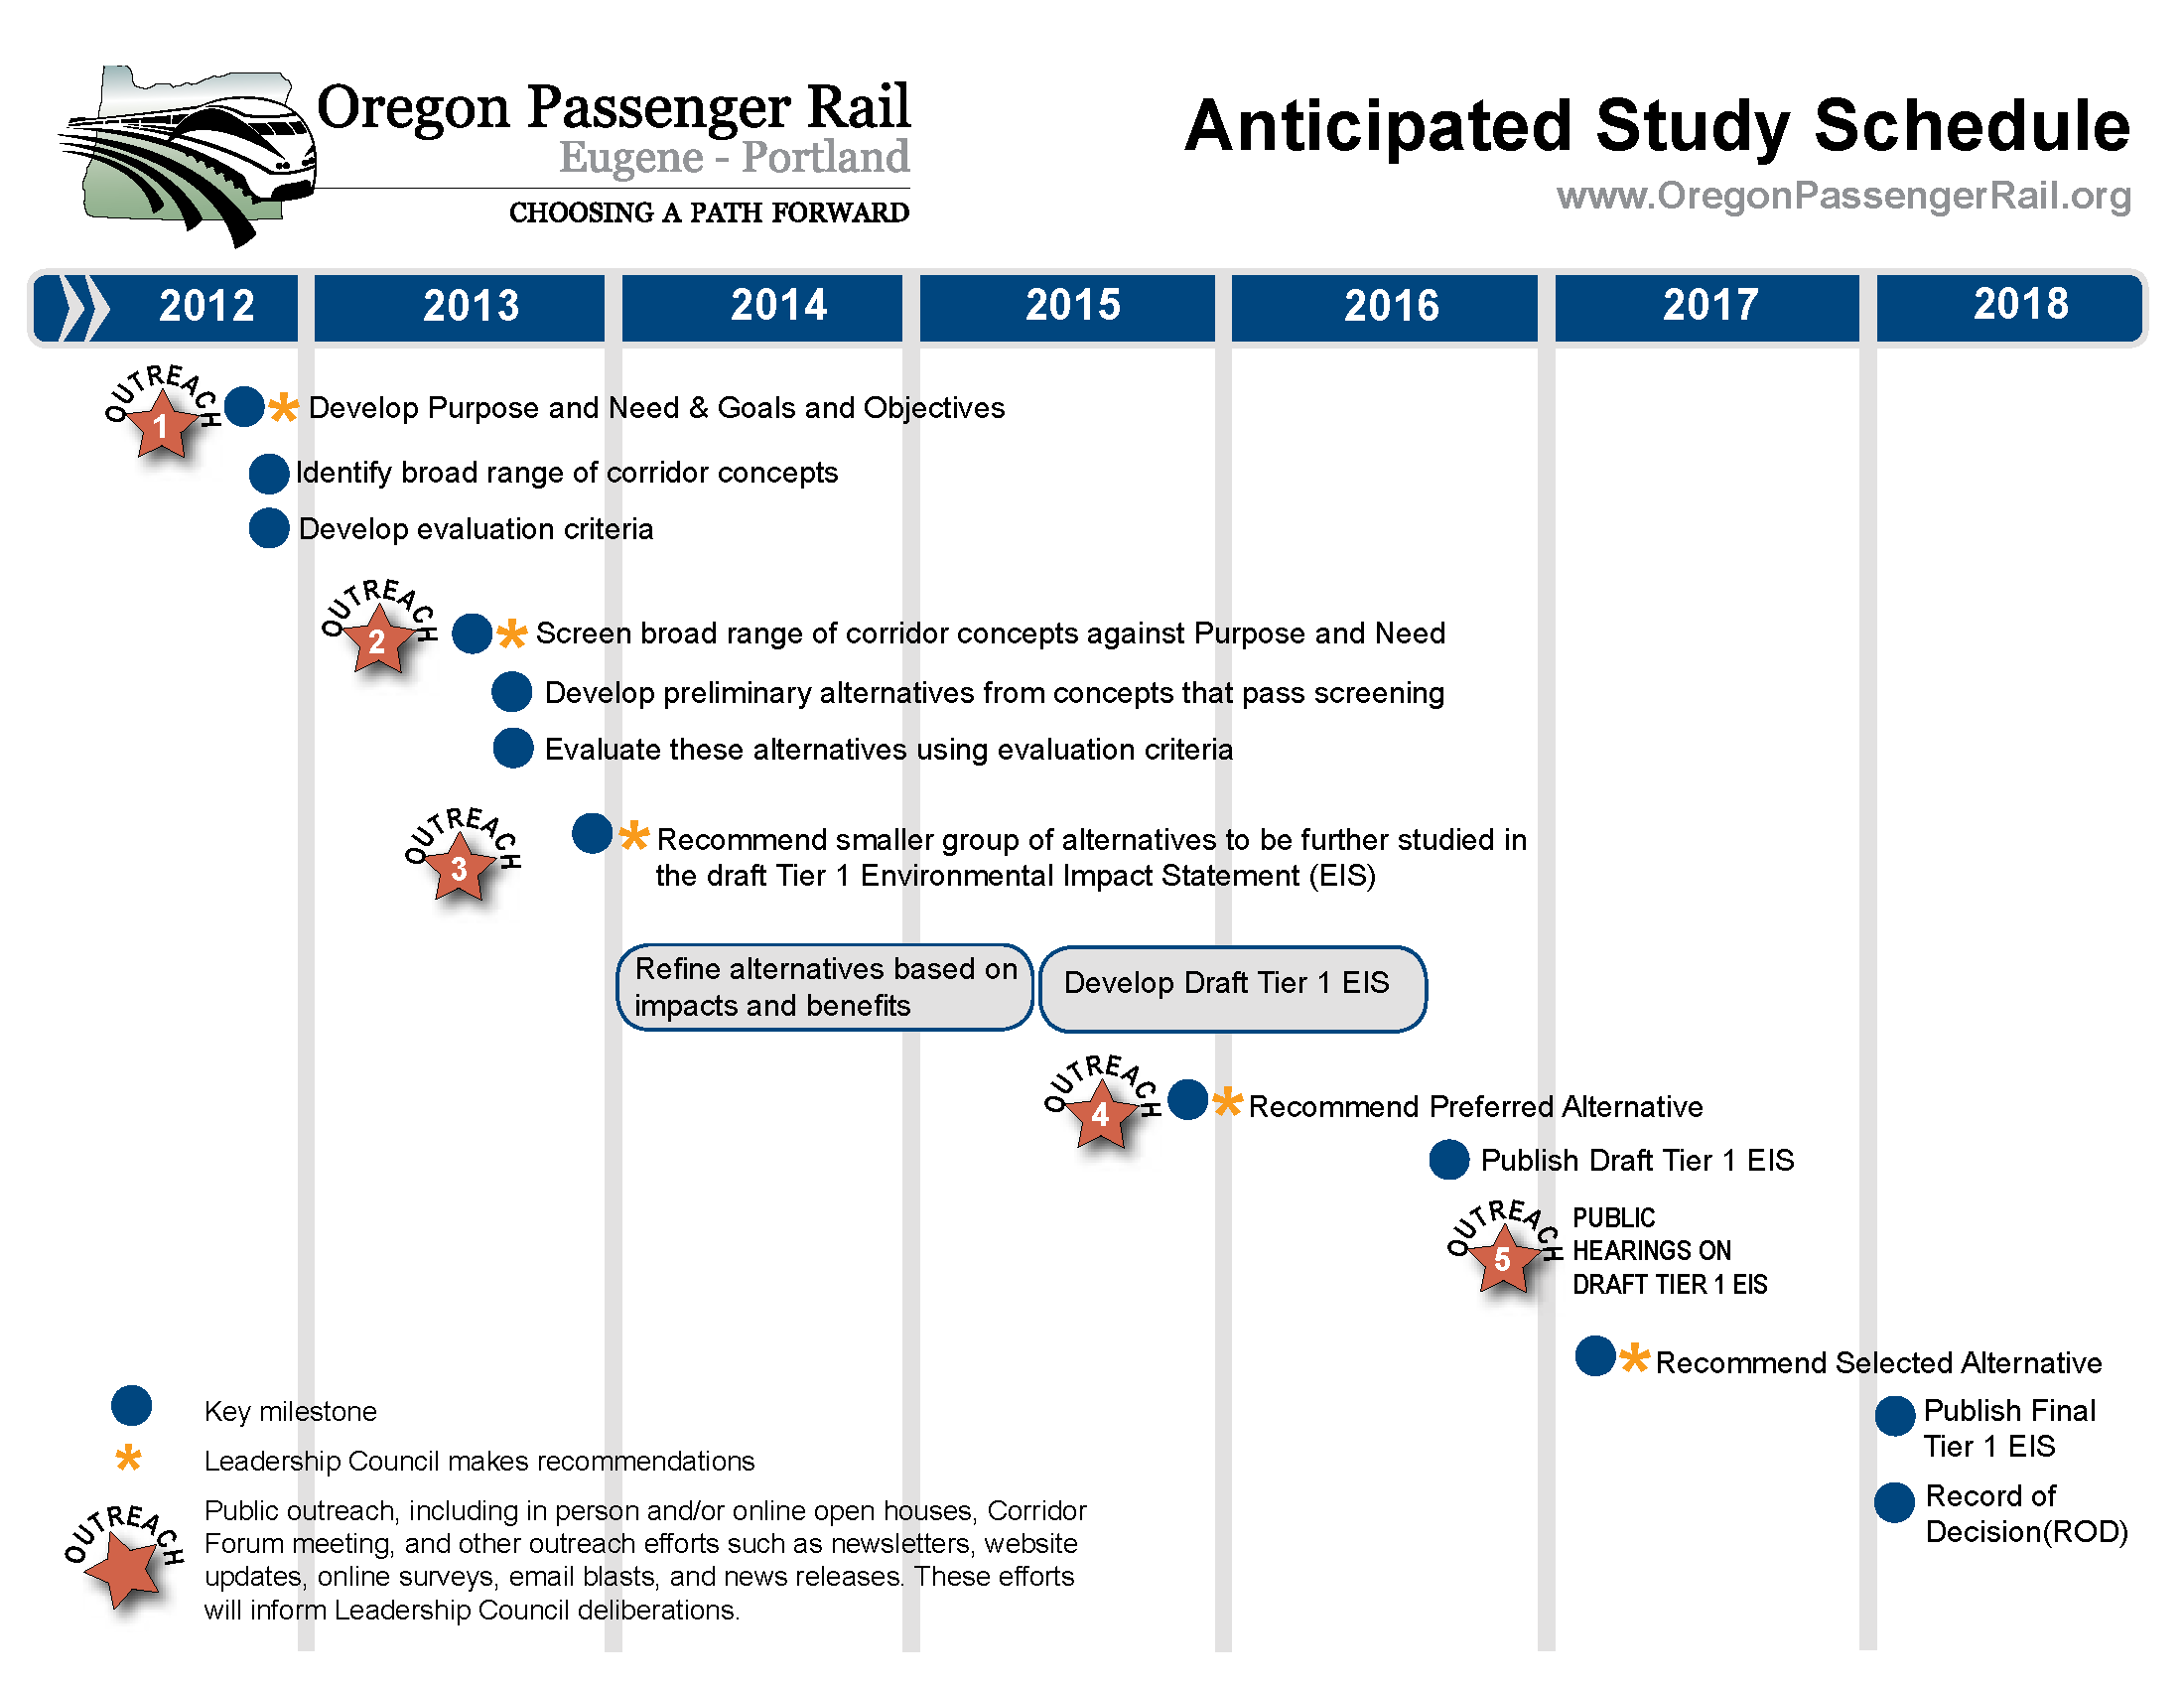
The team has identified a recommended Preferred Alternative to take into the DEIS. The Final EIS and Record of Decision will conclude with a Selected Alternative. The Selected Alternative may be subject to further study before construction can begin.
Purpose and Need
Potential alternatives were required to satisfy the Purpose and Need statement in order to be carried forward as preliminary alternatives for further evaluation.
- Read the Purpose and Need Statement (pdf, 80 kb)
Goals and Objectives
The goals and objectives were developed based on input from the public, stakeholders and the project’s Leadership Council. They were used to create criteria that was then used to narrow the field of preliminary alternatives. You can learn more about the remaining alternatives later in this open house.
- Read the Goals and Objectives (pdf, 126 kb)
DEIS Alternatives
Alternative 1 (Recommended Preferred Alternative)
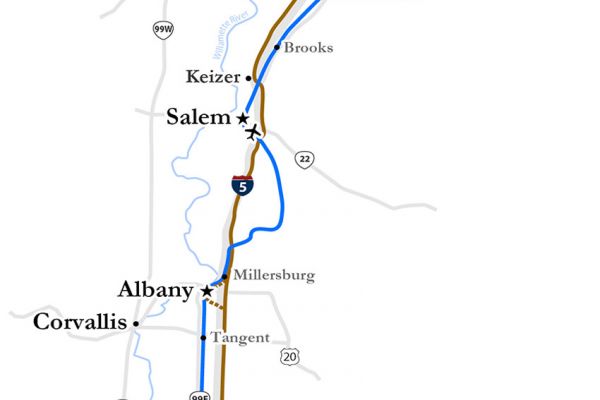
Follows the existing Amtrak Cascades passenger rail route with improvements.
Alternative 2
Primarily a new route between Springfield and Oregon City located along I-5, an existing freight rail line, and I-205. It would follow the existing alignment north of Oregon City.
Oregon Passenger Rail Alternatives Overview
Recommendation
Based on an initial assessment the team is recommending that Alternative 1 be carried forward as the Preferred Alternative in the DEIS. The Leadership Council will consider this recommendation at their meeting in December 2015.
The recommendation is not a final decision - all alternatives will be analyzed in the DEIS before a Final Preferred Alternative is identified.
Based on this assessment, the project team is recommending that Alternative 1 be carried forward as the Preferred Alternative in the DEIS. The recommended Preferred Alternative is not a final decision – all alternatives will be fully studied in the DEIS.
The following matrix includes a summary of the initial results when Alternatives 1 and 2 were compared:
| Better | |
| No Substantial Difference | |
| Worse |
View printable evaluation criteria matrix(pdf, 310 KB)
| 1. Improve passenger rail mobility and accessibility to communities in the Willamette Valley. | ||||||
| Performance Evaluation Measures | No Action | Alternative 1 (Recommended Preferred Alternative) | Alternative 2 | |||
| A. Travel time | 2:35 | 2:20 | 2:02 | |||
| B. Capacity to serve 6 round trips/day | No | Yes | Yes | |||
| C. Multimodal connections | Good at existing stations | Good at existing stations | Fewer than No Action/Alt 1 | |||
| D. Ability to serve higher speeds in the future | Maintains current maximum 79 mph speed | Maintains current max 79 mph speed Increased ridership strengthens market for future service enhancements | Supports max speeds of 120 mph on portions of new alignment | |||
| 2. Protect freight-rail capacity and investments in the corridor, and maintain safety. | ||||||
| Performance Evaluation Measures | No Action | Alternative 1 (Recommended Preferred Alternative) | Alternative 2 | |||
| A. At-grade (street level) crossings | 140 existing at-grade crossings, no modifications | 140 existing at-grade crossings, 64 crossings are modified for additional track and trains | 49 existing at-grade crossings, 44 are modified, plus 1 new at-grade crossing | |||
| B. Ability to accommodate freight | Would get worse without investment | Meets (by design) | Meets (by design) | |||
| 3. Plan, design, implement, maintain, and operate a cost-effective project. | ||||||
| Performance Evaluation Measures | No Action | Alternative 1 (Recommended Preferred Alternative) | Alternative 2 | |||
| A1. Ability to phase improvements | N/A | Could be constructed incrementally | Limited to major sections of new alignment and upgrades to sections of existing track to accommodate | |||
| A2. Costs (capital cost) | N/A | $660-$775 million | $3.65-$4.47 billion (over 5 times higher than Alt 1); does not account for upgrades to portions of track south of Oregon City that would later be abandoned | |||
| A2. Costs (operations and maintenance) | Ongoing based on railroad agreements | ≈ $25 million annually | ≈ $43 million annually; New operations and maintenance responsibility for ODOT | |||
| B1. Population close to station areas | 74,385 | 74,385 | 65,215 | |||
| B2. Employment close to station areas | 180,905 | 180,905 | 123,145 | |||
| C. Projected Annual Ridership (2035) | 390,000 | 739,000 | 723,000 | |||
| 4. Provide an affordable and equitable travel alternative. | ||||||
| Performance Evaluation Measures | No Action | Alternative 1 (Recommended Preferred Alternative) | Alternative 2 | |||
| A. Availability of travel options | No change | Improved train service | Improved train service | |||
| B1. Proximity of low income populations to stations | 8,929 | 8,929 | 10,724 | |||
| B1. Proximity of minority populations to stations | 27,994 | 27,994 | 32,595 | |||
| B2. Low income populations impacted | 14,540 | 14,540 | 16,664 | |||
| B2. Minority populations impacted | 44,024 | 44,024 | 43,313 | |||
| 5. Be compatible with passenger rail investments planned in Washington State. | ||||||
| Performance Evaluation Measures | No Action | Alternative 1 (Recommended Preferred Alternative) | Alternative 2 | |||
| A. Compatibility with WA State (assumed same for all alternatives) | Requires intermodal transfer | Seamless intercity rail service | Seamless intercity rail service | |||
| 6. Promote community health and quality of life for communities along the corridor. | ||||||
| Performance Evaluation Measures | No Action | Alternative 1 (Recommended Preferred Alternative) | Alternative 2 | |||
| A. Location Quotient Score (factor considering land use, employment, and social attributes, provides estimate of development potential) | 1.1 | 1.1 | 0.8 | |||
| B1. Community resources, commercial and residential parcels potentially impacted by rail | 0 | 34 | 49 | |||
| B2. Percent of adjacent land designated for residential use (noise sensitive) | 9.6% | 9.6% | 9.9% | |||
| 7. Protect and preserve the natural and built environment.* | ||||||
| Performance Evaluation Measures | No Action | Alternative 1 (Recommended Preferred Alternative) | Alternative 2 | |||
| A1. Acres farmland potentially impacted (potential ROW impact area) | 0 | 399 acres | 1,312 acres | |||
| A2. Assessment of consistency with adopted regional and local comprehensive plans | N/A | Cities and Counties support or are neutral regading development of passenger rail | Cities and Counties support or are neutral regading development of passenger rail | |||
| A3. Impacts to Willamette River Greenway | None | None anticipated; No existing crossings of the Willamette River anticipated to be modified; no goal exception work would be required | Up to three new crossings would require goal exception work | |||
| B. Qualitative assessment of greenhouse gas emissions from corridor options, based on anticipated vehicle miles traveled (VMT) reduction due to mode shift and temporary construction-related emissions | Relatively low | Long term: Mode shift from bus or car to train saves energy; Construction requirements would create greenhouse gas | Long term: Mode shift from bus or car to train saves energy; Construction requirements would create GHG [approx 3 times Alt 1] | |||
| C1. Qualitative assessment of impacts to habitat, populations, or individuals of Threatened or Endangered species and their critical habitat, as well as impacts to non-listed fish and wildlife | Minimal, same as current conditions | Smaller construction footprint than Alt 2; higher train frequency than no action; one listed plant potentially affected | Larger construction footprint; higher train frequency than no action; Alt 2 has a higher number of stream crossings with new or modified bridge/culverts at designated critical fish habitat than Alt 1. | |||
| C2. Percent of study area that is high value wetlands plus percent of all wetlands potentially impacted | None | 4.4% | 6.6% | |||
| C3. Miles of track through areas with relatively high-risk slopes | 16.9 mi | 16.9 mi (alignment); 4.3 mi (footprint) | 12.4 mi (alignment); X mi (footprint) | |||
| C4. Number of known Section 4(f) resources within 100 feet of the alignment (construction areas only) | 0 | More sites within 100 feet of alignment (122), but less unavoidable direct impacts (up to 3 parks) | Less sites within 100 feet of alignment (64), but more unavoidable direct impacts (up to 5 parks) | |||
| C5. Known cultural resources (historic properties and archaeological resources) within 100 feet of the rail alignment (construction areas only) | 0 | 381 | 392 | |||
| *The environment MOEs are not equal in terms of relative importance. For example, if one alternative results in more severe 4(f) impacts, such a finding could more than counterbalance other measures where the other alternative scores worse. | ||||||
The tabs below highlight some of the key distinguishing features between the Alternatives.
Criteria
Travel Times
The project team looked at projected travel times for each alternative and found that they will vary from one another due to a variety of factors.
Passenger rail travel times were calculated based on:
- The amount of track shared with freight and congestion related delays
- The number of stops and time spent at each station
Compared to No Action, the recommended Preferred Alternative saves 15 minutes in travel time and Alternative 2 saves 33 minutes.
| No Action | Alternative 1 (Recommended Preferred Alternative) | Alternative 2 | ||||
| (Goal 1A.) Travel time | 2:35 | 2:20 | 2:02 | |||
Stations and Transportation Connections
Intercity passenger rail stations are where all passengers’ trips begin and end, and where people connect with other transportation modes. Unlike city bus, light rail or commuter rail service that provides several stops or stations within relatively short distances, intercity passenger rail ideally connects major population centers longer distances apart with fewer stops. This is so that it can provide faster intercity connectivity and compete with travel by automobile and intercity bus.
These longer intercity passenger rail trips are ideally supported by other regional and local transit service that connect directly to the rail stations. For intercity passenger rail to function most cost-effectively and efficiently, stations must serve the largest population concentrations with the fewest stops, because with every stop at a station, the travel time of a train is extended.
Careful consideration of each station location is essential to ensure that each station:
- Reduces travel times
- Serves locations with the most people and jobs near the stations
- Is well integrated into the local transportation network
The recommended Preferred Alternative would retain existing intercity passenger rail stations in or very near established and active downtown core areas of Eugene, Albany, Salem, Oregon City and Portland. These stations are surrounded by dense urban areas that offer a broad mix of housing, jobs, and other attractions. These stations are also relatively convenient for most people to connect with using regional or local transit, walking, or bicycling.
Alternative 2 would require some new stations near Interstate 5 in Springfield, Salem or Keizer, Wilsonville or Tualatin, and possibly in Albany. The existing surroundings of these potential new stations generally consist of less densely-developed area and would require more people to drive longer distances. Due to the locations of these new stations, ridership forecasts indicate even with train travel time savings associated with Alternative 2, this savings would be offset by lower ridership.
- View the OPR Station Area Assessments (pdf, 19.1mb)
Ability to Build Incrementally
One major difference between the two build alternatives is the ability to build incrementally, potentially increasing from two daily Cascades round trips to six over time.
The recommended Preferred Alternative follows the existing Amtrak passenger route and could be improved in key sections as funding is made available. Alternative 2 would require significant funding, construction and time to complete improvements before any passenger rail service can begin because it is largely an entirely new alignment.
Building Towards True High Speed Rail
Population forecasts for the Willamette Valley do not reach levels over the next 50 years that would support the infrastructure investment required for electrified service above 120 miles per hour. Higher speed rail would require passenger rail to run on its own alignment instead of sharing track with freight rail and also need to be supported by a substantial increase in population. The recommended Preferred Alternative may help build ridership in the future by making improvements in service that will increase demand.
In a separate effort a long-range (beyond 50 years) vision was developed in 2014 for what high speed rail might eventually look like in this corridor.
- View the High Speed Rail Concept Vision Report (pdf, 4.4mb).
Cost and Ridership
The 2035 ridership projections for the Preferred Alternative and Alternative 2 are similar. While Alternative 2 has a faster travel time, the Preferred Alternative would attract more people choosing to use passenger rail or throughway buses because they live, work or go to school in proximity to stations that are already located in city centers. Because Alternative 2 would attract less riders and cost significantly more, the Preferred Alternative provides the most cost-effective choice.
| No Action | Alternative 1 (Recommended Preferred Alternative) | Alternative 2 | ||||
| (Goal 3A2.) Costs (capital cost) | N/A | $660-$775 million | $3.65-$4.47 billion (over 5 times higher than Alt 1); and does not account for upgrades to portions of track south of Oregon City that would later be abandoned | |||
| (Goal 3C.) Ridership (2035 Annual) | 390,000 | 739,000 | 723,000 | |||
| Capital cost per new rider (was considered in support of goal 3) | N/A | $2,100 | $12,200 | |||
Community and Social Impacts
Population and employment near the recommended Preferred Alternative stations are significantly higher than Alternative 2. The Preferred Alternative stations have the ability to provide greater community benefits as they are located in city centers, and a stronger potential to draw ridership and attract economic development.
Both Alternatives have impacts to parks. The recommended Preferred Alternative can potentially affect up to three parks. Alternative 2 could affect up to five, including running through the Eastgate Woodlands/Alton Baker Park in Springfield.
| No Action | Alternative 1 (Recommended Preferred Alternative) | Alternative 2 | ||||
| (Goal 3B2.) Employment close to station areas | 180,905 | 180,905 | 123,145 | |||
| (Goal 3B1.) Population close to station areas | 74,385 | 74,385 | 65,215 | |||
| (Goal 7C4.) Number of known Section 4(f) resources within 100 feet of the alignment (construction areas only) | 0 | More sites within 100 feet of alignment (122), but less unavoidable direct impacts (up to 3 parks) | Less sites within 100 feet of alignment (64), but more unavoidable direct impacts (up to 5 parks) | |||
Natural Environment
The Alternatives travel through the Willamette Valley, a fertile farming area. The No Action option would not impact farmland. However, both of the build Alternatives would require farmland to be used for railroad right-of-way. Based on the projected construction requirements, the recommended Preferred Alternative would require the use of far less farmland compared to Alternative 2.
| No Action | Alternative 1 (Recommended Preferred Alternative) | Alternative 2 | ||||
| (Goal 7A1.) Acres of farmland potentially impacted | 0 | 399 acres | 1,312 acres | |||
OPR Process
Contact Us
- Jim Cox, ODOT Project Manager - (503) 986-6612
- Jill Pearson, Stakeholder Engagement Strategist - (503) 986-3313
Comments
Mailing list (Optional)
Provide the following optional contact information if you would like to be added to the project mailing list.
Demographic Information (Optional)
This project is requesting demographic information to evaluate the effectiveness of public outreach activities. The identity of individuals is kept confidential. The results are reported as totals only, and used solely to help improve future community engagement. Providing this information is voluntary and optional.

