
This interactive tool includes ten pages where you can learn more about the project and provide your comments. We invite you to explore this information and give us your feedback.
Open House Stations


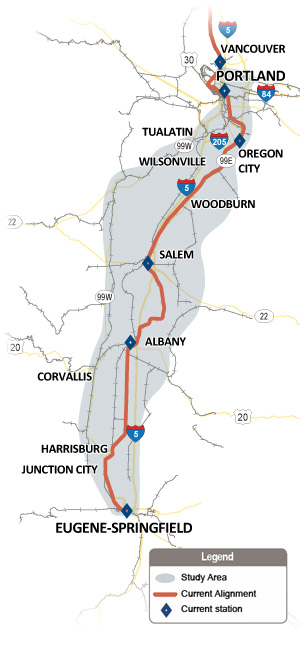
The project will study options to improve passenger rail service between Eugene-Springfield and Portland-Vancouver, Wash. This area is part of the Pacific Northwest Rail Corridor, which extends from Eugene, OR to Vancouver, BC. It is designated as a regional high speed rail corridor, which means planning for top speeds of 90-125 mph.
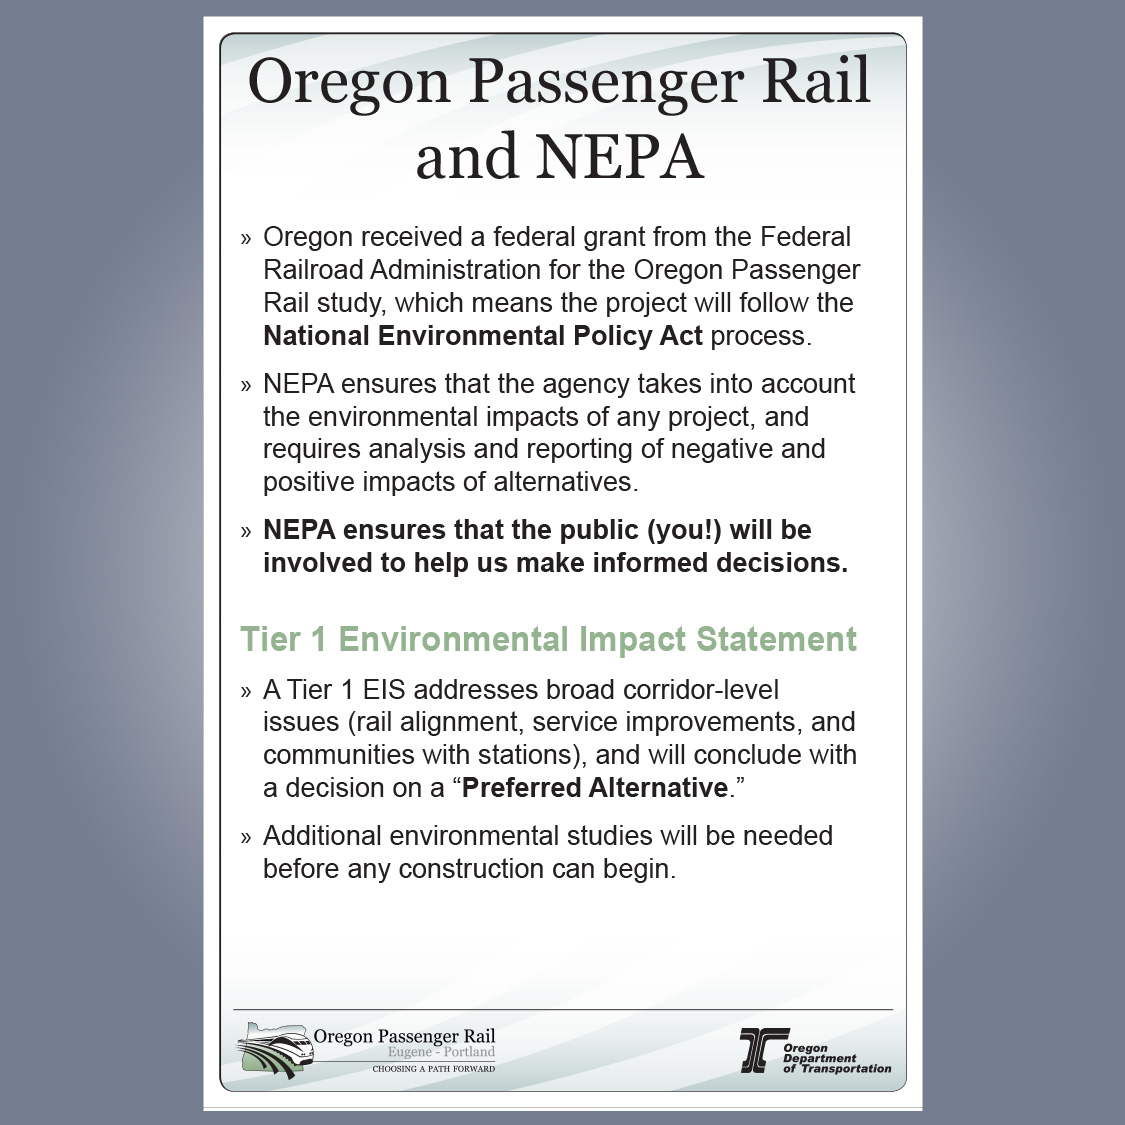
The project team is conducting a National Environmental Protection Act (NEPA) environmental review process, which will make decisions on:
- How frequent and fast rail service should be.
- What rail route should be used.
- What kinds of technology should be used.
- Where stations should be located.
- Whether it should be different than what exists today.


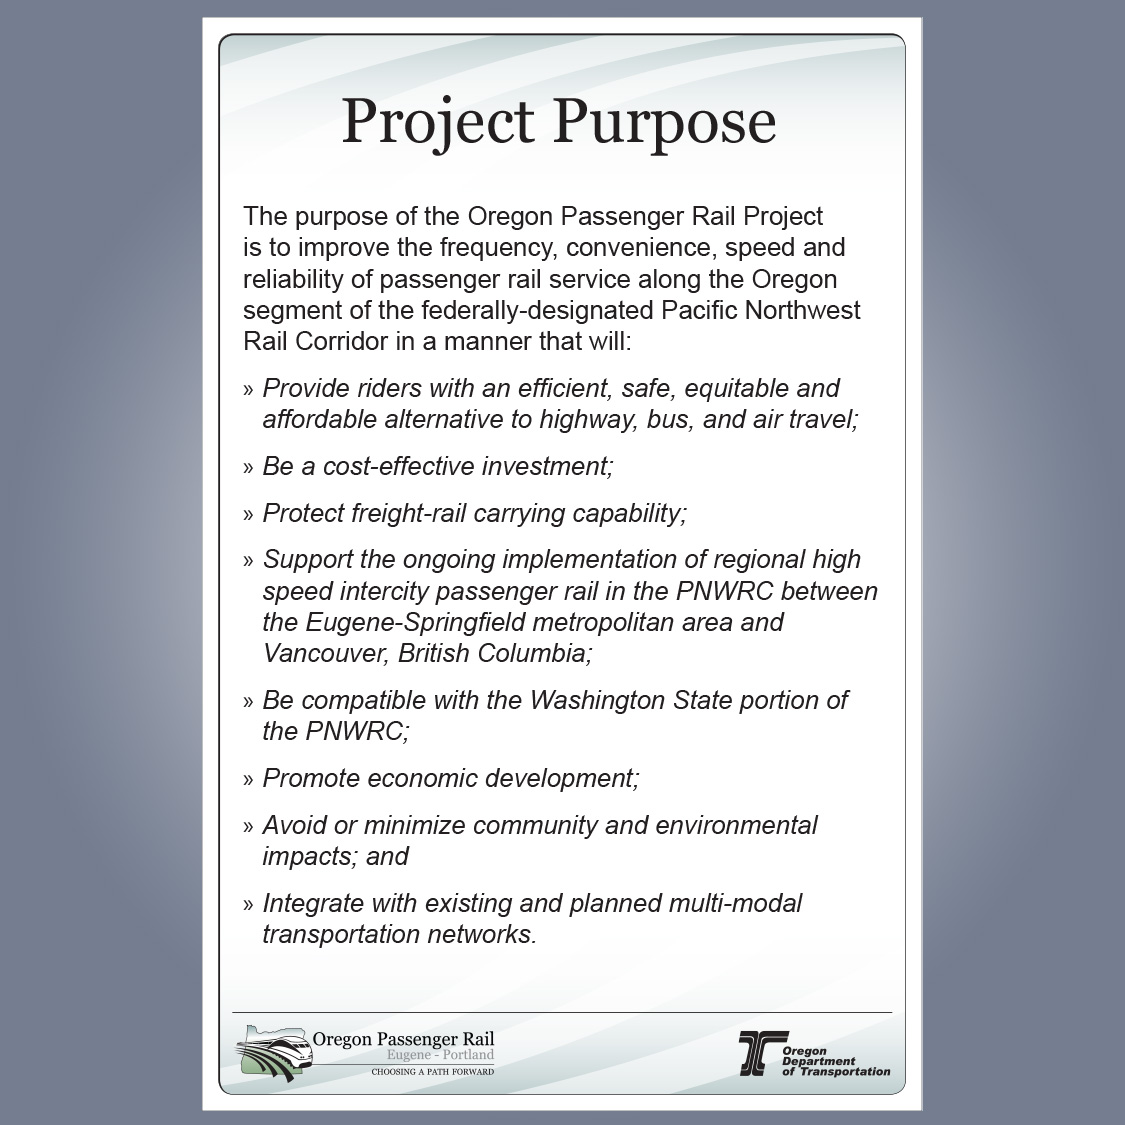
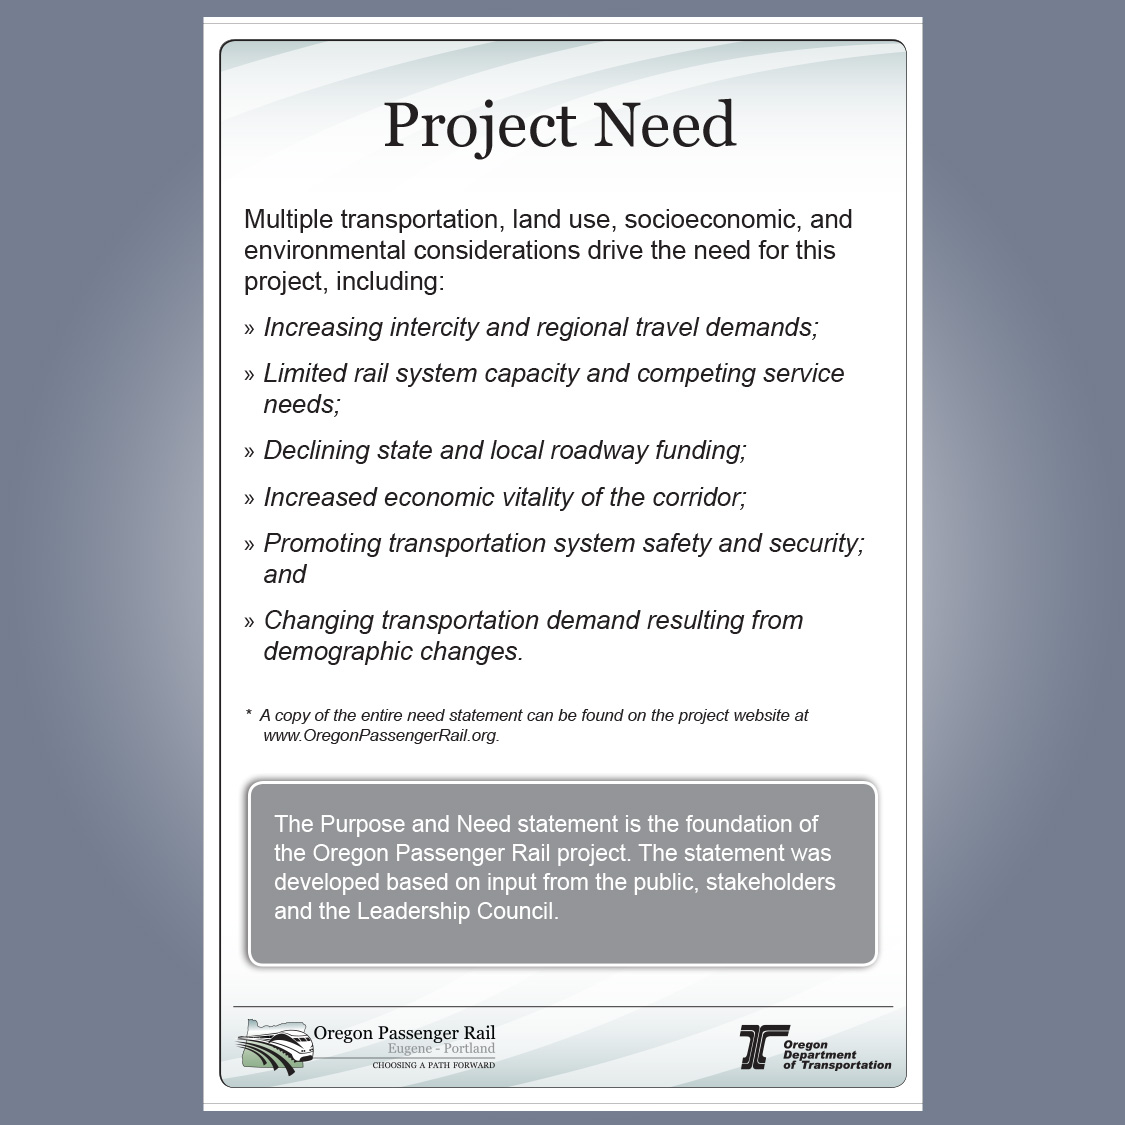
Project Purpose and Need
The Purpose and Need statement is the foundation of this study. A rail route alternative must meet the Purpose and Need statement to be further evaluated. Earlier this year, the project team “screened” a broad range of rail route alignment options called corridor concepts against the Purpose and Need. We presented those results to the public and to the project committees. Corridor concepts that did not pass did not move forward for further evaluation. The corridor concepts that did pass screening were refined into a set of preliminary alternatives which were then evaluated using the project goals and objectives.
Goals and Objectives
The goals and objectives provide the basis for evaluation of the preliminary rail route alternatives. As you’ll see later in this online open house, preliminary alternatives were scored on how well they meet the goals and objectives.
Goal 1: Improve passenger rail mobility and accessibility to communities in the Willamette Valley.
Objectives:
- 1A - Provide a viable alternative to auto, air, and bus travel between Eugene and Vancouver, WA.
- 1B - Provide reliable and frequent passenger rail service.
- 1C - Support multimodal integration at each passenger rail station.
- 1D - Allow for future passenger rail improvements, including higher speeds.
Goal 2: Protect freight-rail capacity and investments in the corridor, and maintain safety.
Objectives:
- 2A - Does not increase conflicts between passenger rail or freight rail and vehicles.
- 2B - Protect freight-rail carrying capability.
Goal 3: Plan, design, implement, maintain, and operate a cost-effective project.
Objectives:
- 3A - Develop a strategy that can be reasonably funded and leveraged with range of investment tools for construction and operation.
- 3B - Serve the maximum number of people with every dollar invested.
Goal 4: Provide an affordable and equitable travel alternative.
Objectives:
- 4A - Provide a viable and affordable alternative for travelers.
- 4B - Provide equitable investments and service, with consideration to race/ethnicity and income.
Goal 5: Be compatible with passenger rail investments planned in Washington State.
Objective:
- 5A - Provide passenger rail service to meet the existing and future passenger rail demand for an interconnected system in the Pacific Northwest High Speed Rail corridor.
Goal 6: Promote community health and quality of life for communities along the corridor.
Objectives:
- 6A - Benefit communities within the corridor.
- 6B - Minimize negative impacts to communities along the corridor.
Goal 7: Protect and preserve the existing natural and built environment.
Objectives:
- 7A - Support Oregon’s commitment to the preservation of resource lands and local land use and transportation planning.
- 7B - Reduce greenhouse gas emissions in support of national and state policies to slow climate change.
- 7C - Avoid and minimize impacts to the natural environment and cultural resources.
In the summer and fall of 2012, ODOT asked the public to weigh in on what passenger rail should look like in the Willamette Valley. We received over 800 comments with ideas for station locations, alignment options, and ways to improve service.
The project team created a broad range of "corridor concepts" - ideas for rail routes based on public input. Corridor concepts were screened against the project Purpose and Need. Those that passed screening were refined into a set of preliminary alternatives.
This summer, the project team evaluated the preliminary alternatives using criteria based on the project goals and objectives. We are sharing those results with you now.


Screening
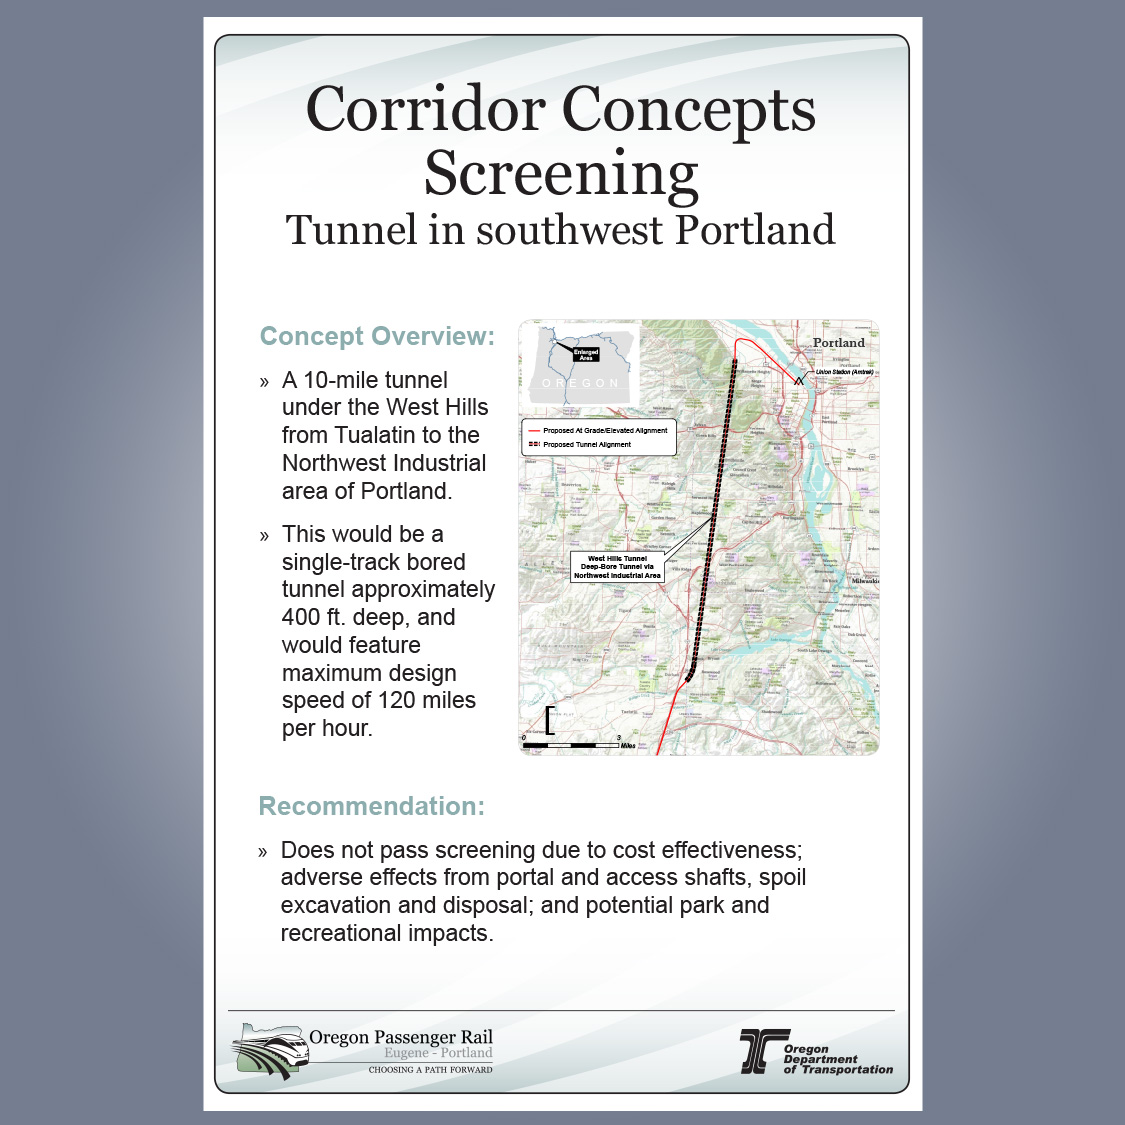
Tunnel in Southwest Portland
- Why was this screened? More information has been developed on costs that affect the screening discussion.
- Recommendation: The project team recommends screening out this concept because it is not cost-effective. It would also cause negative effects from the portal and access shafts, spoil excavation and disposal; and potential park and recreational impacts.
- Read the Tunnel in Southwest Portland Screening Memo
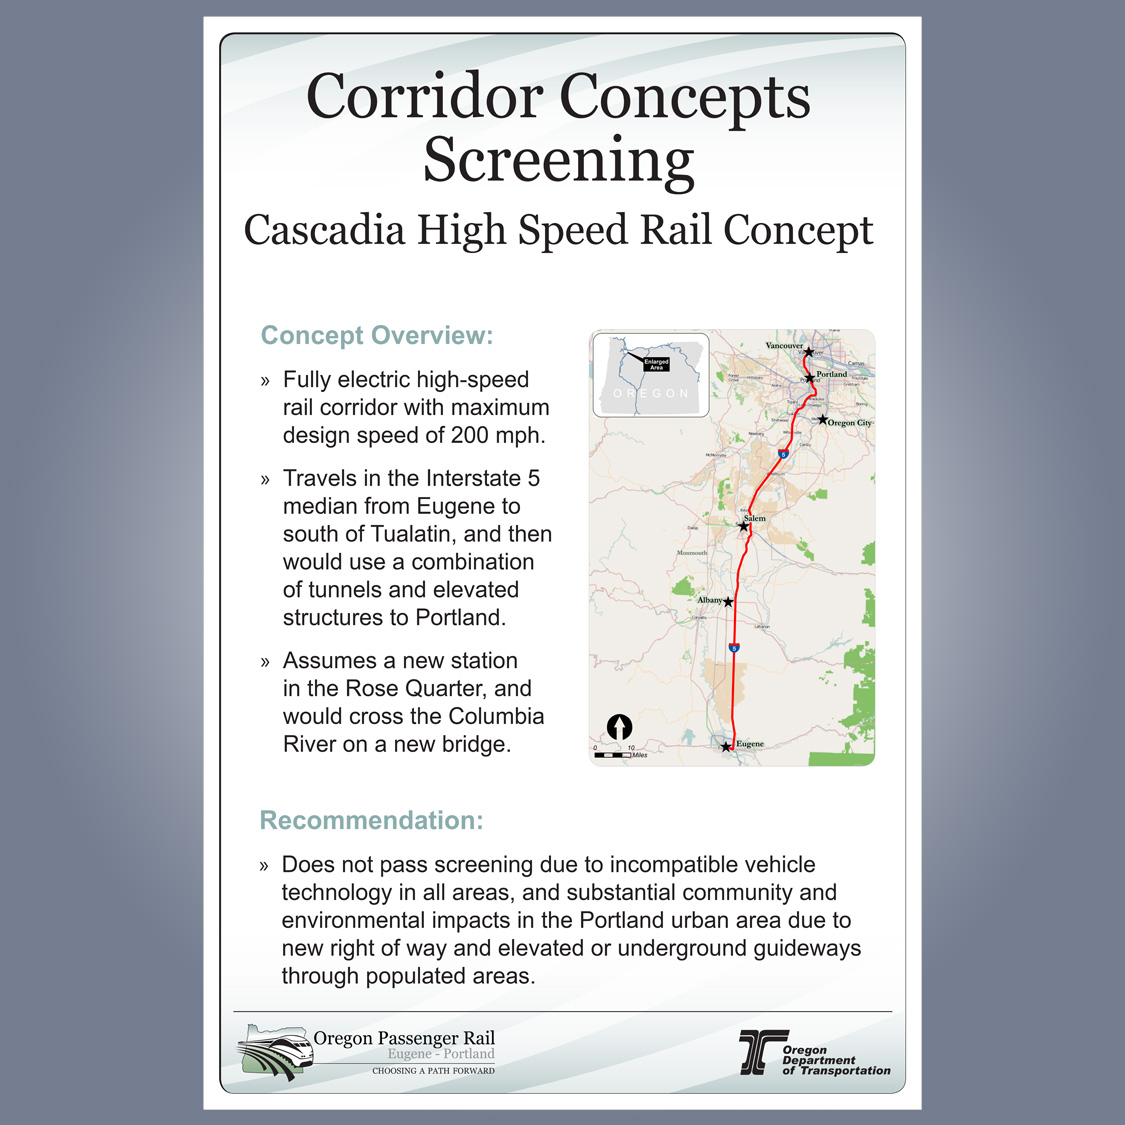
Cascadia High Speed Rail
- Why was this screened?Stakeholders alerted the project team that the Red (Interstate 5) preliminary alternative does not capture specifics of the Cascadia High Speed Rail concept.
- Recommendation: The project team recommends screening out this concept because it uses incompatible vehicle technology (full electric). It also would cause substantial community and environmental impacts in the Portland urban area.
- Read the Cascadia High Speed Rail Screening Memo
Due to the size of the overall corridor and varying options throughout the corridor, the project team divided the corridor into three sections for the alternatives evaluation process. To read a detailed memo about the evaluation results, read the Alternatives Evaluation Results Memorandum.
About cost estimates and estimated travel times
- Cost estimates are planning-level construction and engineering estimates and do not include ongoing operations or maintenance costs. Costs are in 2013 dollars.
- Estimated travel times assume stops at five stations (same as existing service). Each additional stop would add time. The current scheduled travel time from Portland to Eugene is 2 hr, 35 min.
Section C
(N. of Wilsonville to Vancouver, Wash.)
- Range of Cost Estimates - $1 billion to $3.5 billion
- Range of Travel Time Estimates - 35 to 55 minutes, plus stop in Portland
(Travel time from N. of Wilsonville to Portland is 25 to 35 minutes, and from Portland to Vancouver, Wash. is 10 to 20 minutes. The current dwell time in Portland is approx. 40 minutes.)
Section B
(N. of Albany to N. of Wilsonville)
- Range of Cost Estimates - $1 billion to $2 billion
- Range of Travel Time Estimates - 40 to 60 minutes
Section A
(Eugene-Springfield to N. of Albany)
- Range of Cost Estimates - $1 billion to $1.5 billion
- Range of Travel Time Estimates - 35 to 55 minutes
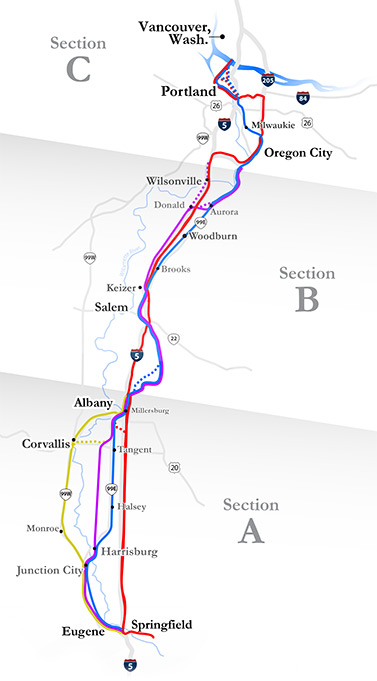
Map of Preliminary Alternatives in Three Sections
Evaluation Results
Scores
Higher score means that the alternative performs better in meeting the goals and objectives

Performance/Cost Comparison
Larger circles indicate a better score to cost ratio.

Key Findings
BluePerforms well in Goal 3:
RedPerforms well in Goals 1 and 2:
| PurpleDoes not perform as well as blue or red YellowDoes not perform well in part due to:
|
Score
Higher score means that the alternative performs better in meeting the goals and objectives

Performance/Cost Comparison
(Larger circles indicate a better score to cost ratio.)

Key Findings
BluePerforms well in Goal 3:
| RedPerforms well in Goals 1 and 2:
Performs poorly in Goal 3 (cost effectiveness) PurpleWilsonville option performs the best for purple - performs better under Goals 3 (mobility) and 7 (environment) |
Score
Higher score means that the alternative performs better in meeting the goals and objectives

Performance/Cost Comparison
(Larger circles indicate a better score to cost ratio.)

Key Findings
Blue
Blue (Eastside Options 1 and 2)
| Red
|
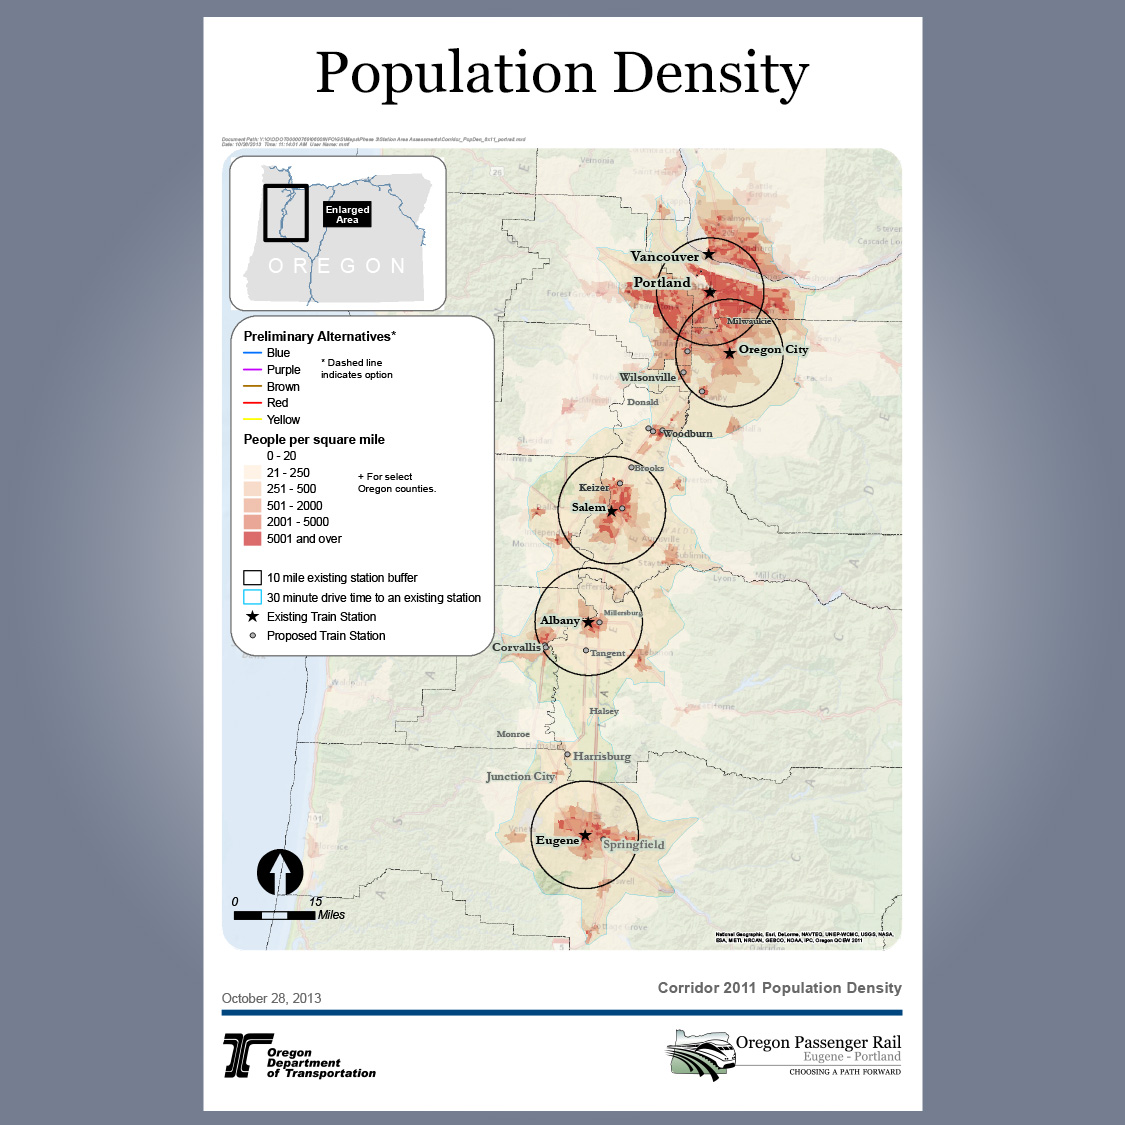
Population Density

Evaluation Framework
Potential stations were proposed by members of the public during public outreach in the fall of 2012. The project team evaluated existing and potential station locations to help determine which communities have the most advantageous factors to support a rail station and to help fulfill the project goals and objectives. Unlike light rail or commuter rail service, intercity passenger rail has fewer stops, so that it can provide faster intercity connectivity. Therefore, careful consideration of each station location is essential to making sure that each station located along the rail line provides intercity mobility, meets service targets for travel time, and is well integrated into the local urban transportation network.
Two main questions were asked for each existing and potential station location:
- Does the station location have the existing or potential travel market to support a station? If so, does it provide an operational benefit or impact on the rail corridor connecting other cities and regions?
- Is the station community a suitable location for a station because it has high employment and/or residential densities and key attractors, and offers interconnectivity with nearby local transit and a consistent, connected pedestrian and bicycle network?
Ridership Information
Potential market demand is a key factor in determining station locations and investment decisions. The charts below show how many people board and disembark at current stations, as well as ridership numbers in the major segments of the Cascades corridor.


Narrowing Alternatives

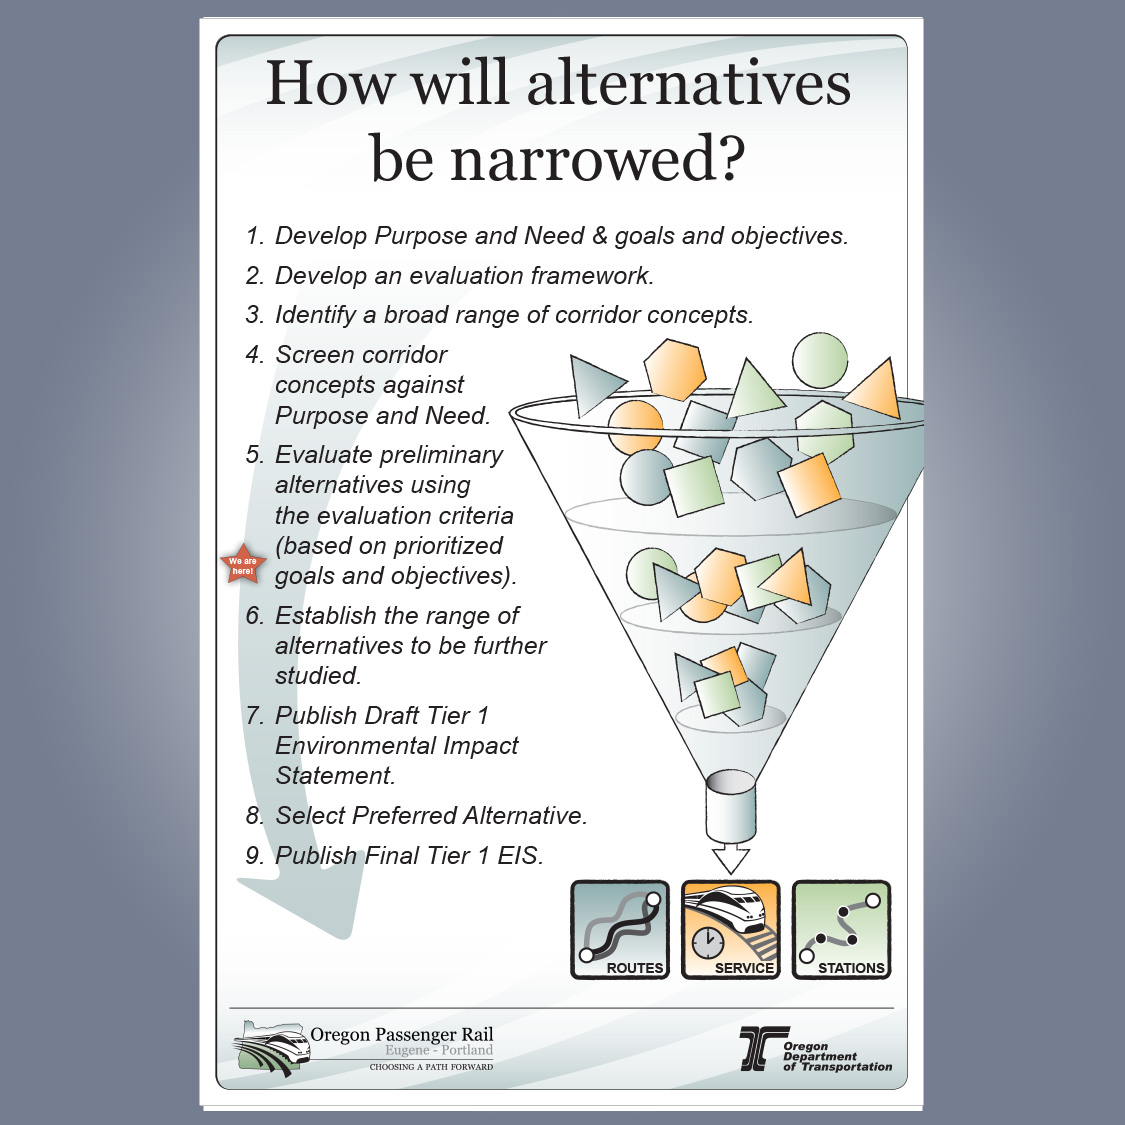
On December 17, 2013 the Leadership Council will be asked to make a recommendation on which preliminary alternatives should be forwarded for further study in the Draft Environmental Impact Statement. It is important that we receive all public feedback by November 18 so that it can be compiled and presented to the Leadership Council before their deliberations.
Ultimately, the Federal Railroad Administration will decide which of the preliminary alternatives should be further studied.
